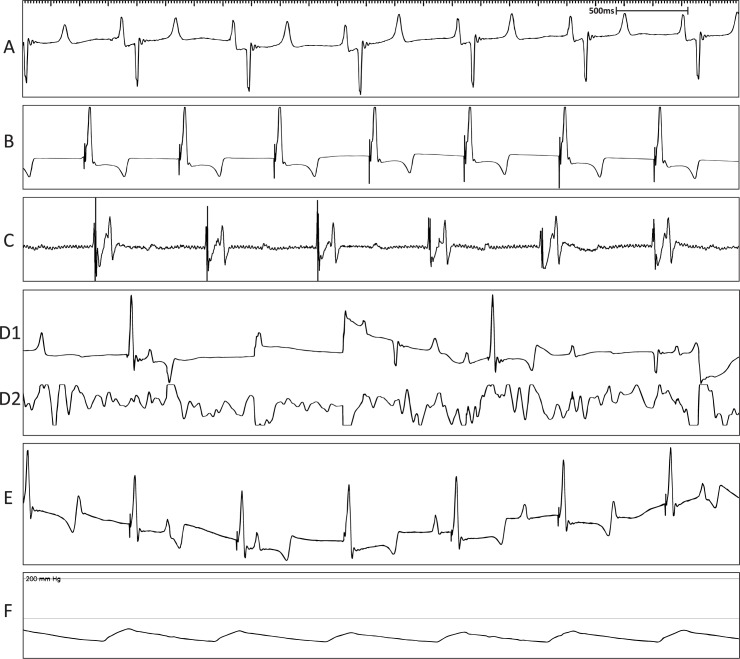
Fig 5. Representative surface ECG recordings during the ablation procedure confirming AVB model creation.
(A) Surface ECG depicting normal sinus rhythm under anaesthesia. (B) Surface ECG depicting pacing rhythm during pacemaker diagnostics. (C) Bipolar electrogram from the ablation catheter proximal pair showing His electrogram before ablation. (D1) Surface ECG during ablation. (D2) Bipolar electrogram from the ablation catheter proximal pair during the ablation. (E) Surface ECG showing AVB evident by AV dissociation. (F) Mean arterial blood pressure trace indicating maintenance of blood pressure throughout the procedure.

