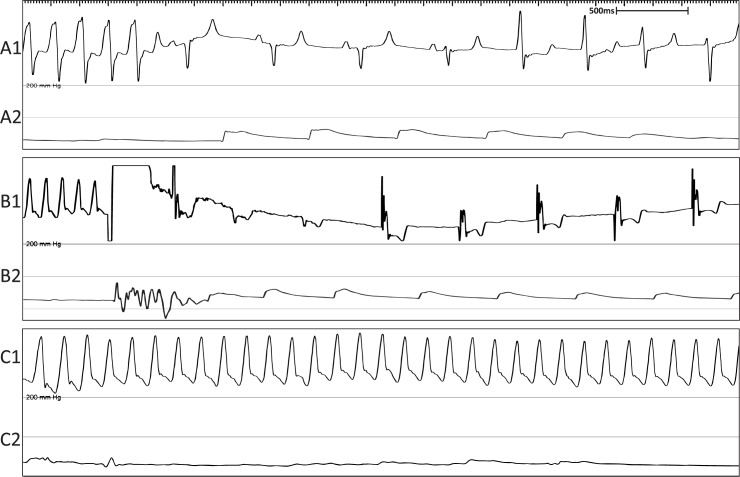
Fig 8. Representative surface ECG recordings showing VT and VF experienced during the ablation procedure.
(A1) Surface ECG showing non-sustained VT. (A2) Mean arterial blood pressure trace indicating return of normal blood pressure following termination of VT. (B1) Surface ECG showing cardioverted VF. (B2) Mean arterial blood pressure trace indicating return of normal blood pressure following cardioversion of VF. (C1) Surface ECG showing VF causing death. (C2) Mean arterial blood pressure trace showing no blood pressure during VF.

