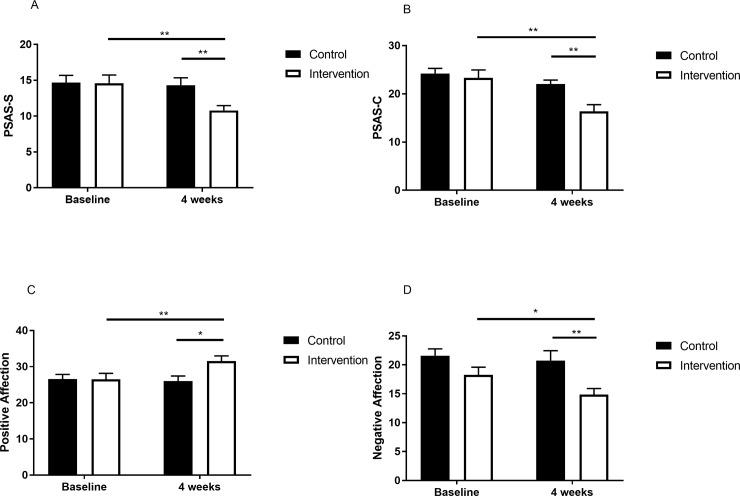
Fig 3. The change in pre-sleep hyperarousal and mood after the intervention.
A, PSAS-S at baseline and at the end of intervention. B, PSAS-C at baseline and at the end of intervention. C, positive affection at baseline and at the end of intervention. D, negative affection at baseline and at the end of intervention. Note: PSAS-S, Pre-sleep Arousal Scale Somatic Arousal; PSAS-C, Pre-sleep Arousal Scale Cognitive Arousal. Intervention group is designated with a white square; control group is designated with a black square. *p<0.05. **p<0.01.

