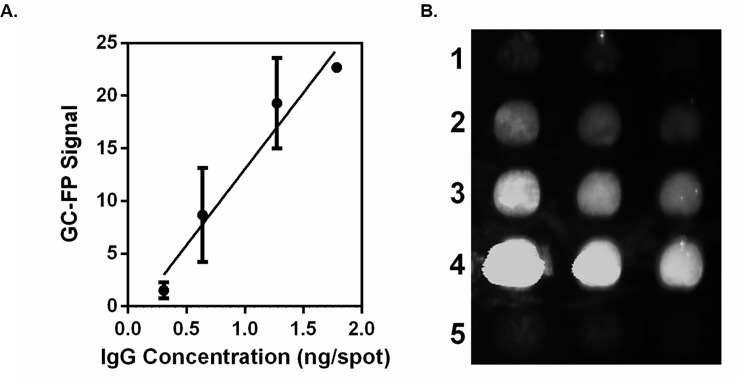
Fig 3. The GC-FP platform and its linear range of IgG antibody detection.
(A) A GC-FP biochip coated with various amounts of IgG (0.306, 0.638, 1.275, and 1.785 ng/spot) was analyzed. The mean GC-FP signal ± Standard Deviation for each IgG concentration is plotted. Linear regression analysis of the plotted curve yields an R2 value of 0.96. (B) The GC-FP image of spots from lowest to highest IgG concentration (1–4) is shown along with the negative control spots containing 1.275 ng/spot BSA (5). Qualitatively, IgG at 1.275 ng/spot and above is clearly visible above background signal.

