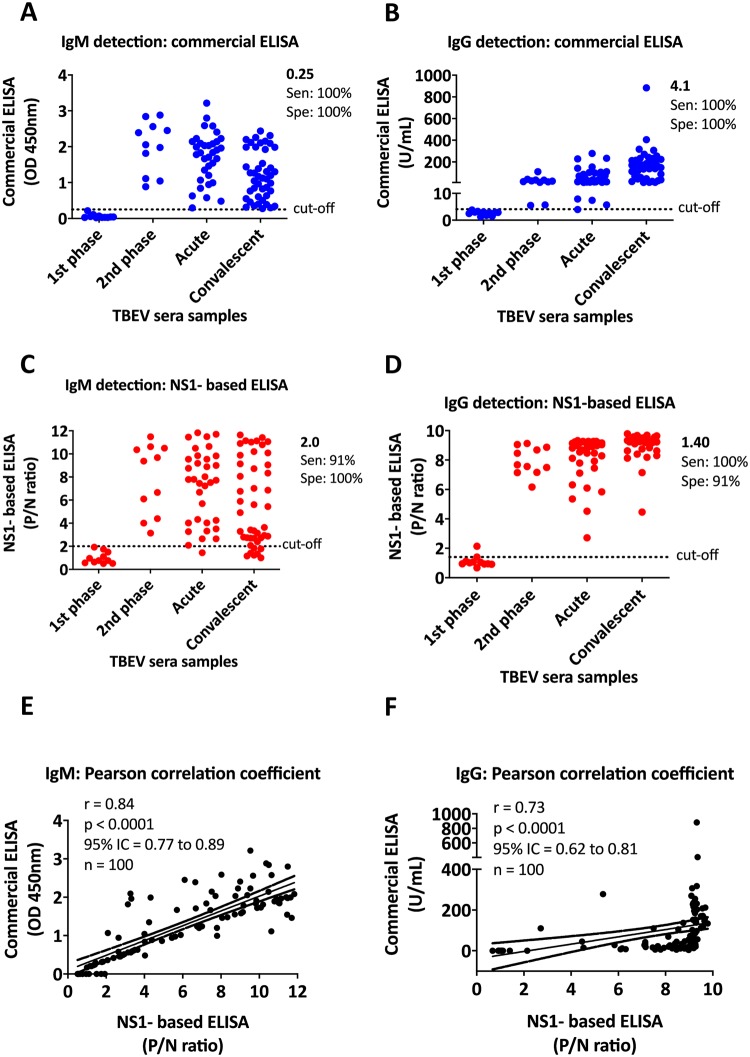
Fig 3. Detection of IgM/IgG antibodies from TBEV infected individuals.
A and B) Detection of IgM (A) IgG (B) antibodies by commercial ELISA. IgM results are reported as OD450, while IgG results are reported as U/mL. Cut-off values for IgM (0.25) and IgG (4.1) were calculated according to the manufacturer’s instructions. C and D) Detection of IgM (C) IgG (D) antibodies by TBEV rNS1-based ELISA. Optimal cut-off values of the P/N ratio (OD450 of test specimen divided by the mean OD450 of negative control specimens) were calculated based on the comparative receiver operating characteristic (ROC) curve analysis. Cut-off values for IgM and IgG fell at 2.0 and 1.40, respectively. E and F) Correlation between commercial and TBEV rNS1-based ELISA assays. The two-tailed Pearson’s correlation value (r) was calculated for IgM and IgG values. A P value of <0.0001 rejected the null hypothesis that there exists no correlation between commercial and rNS1-based ELISA methods. 95% Interval Confidence (IC) value is also indicated and showed in dotted lines above and under the linear correlation. 100 sera samples (n) from different phases of TBEV infection were included in the analysis. * each ELISA result includes the average of two biological replicates.

