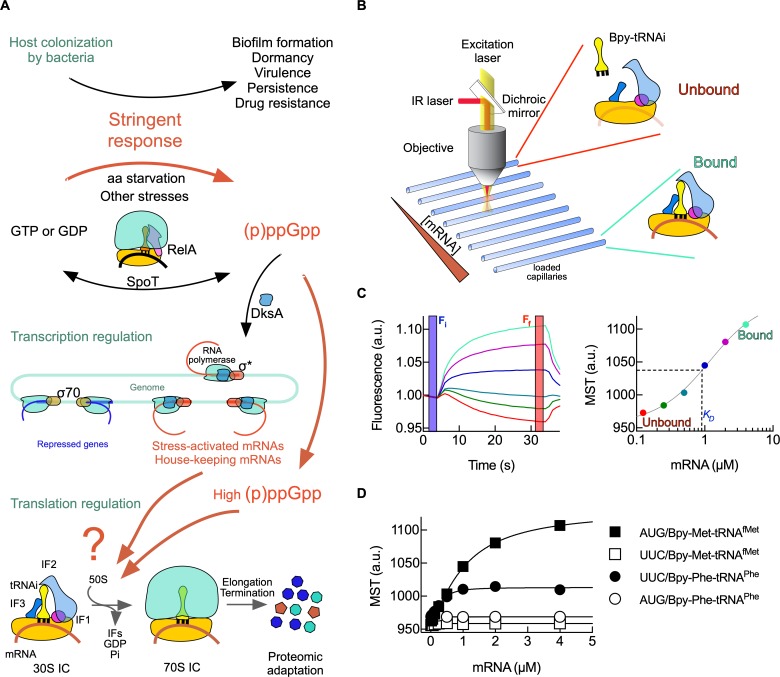
Fig 1. Bacterial stringent response and experimental approach.
(A) Schematics representing the onset of stringent response, (p)ppGpp accumulation, and gene expression regulation. Translation of stress-related mRNAs upon (p)ppGpp accumulating is the focus of the investigation (indicated as the red question mark). (B) Schematics of instrumentation for measuring 30S initiation complex (IC) by fluorescence Microscale Thermophoresis (MST) (provided by Nanotemper Technologies). Generally, each capillary was loaded with 1 μM 30S subunits, 4 μM mRNA, 2 μM IF1, 1 μM IF2, 1.5 μM IF3, 0.5 μM Bpy-Met-tRNAfMet (Bpy-tRNAi), 0.2 mM guanosine nucleotides, and varying concentrations of the tested ligand. Fluorophore excitation and measurement of the emitted fluorescence, together with IR-mediated perturbation of the equilibrium, are achieved through an objective and dichroic mirror. (C) Time courses of fluorescence showing the equilibrium relaxation upon thermal perturbation at varying ligand concentrations. Blue vertical lines indicate the fluorescence signal readout prior to the equilibrium perturbation (Fi), while vertical red lines indicate the fluorescence signal upon reaching the new equilibrium (Ff). Colored traces represent different concentrations of the titrating mRNA (0.1 to 4 μM). The ratio between the Ff over Fi times 1,000 is the normalized thermophoresis shift (MST). The dependency of MST shift on ligand concentration allows to estimate KD constants of the interaction using a hyperbolic or quadratic function and nonlinear regression fitting. MST measurements (closed circles) are indicated in the same colors as their respective time traces in (C). (D) Formation of 30S IC measured by MST. Time traces of thermophoresis (S1 Fig) were used to calculate MST values for all four combinations of mRNA start codons and labeled tRNAs for dependencies on mRNA concentration. Squares indicate 30S ICs programmed with AUG mRNA, while circles show that UUC was used as start site. Closed symbols indicate that Bpy-Met-tRNAfMet was used, while open symbols correspond to Bpy-Phe-tRNAPhe. Continuous lines indicate nonlinear regression fittings. Three to four measurements were performed; mean and error bars representing standard deviations are plotted (S1 Data). Bpy, BODIPY fluorophore; DksA, RNA polymerase-binding transcription factor DksA; GDP, guanosine diphosphate; GTP, guanosine triphosphate; IC, initiation complex; IF1, translation initiation factor IF1; IF2, translation initiation factor IF2; IF3, translation initiation factor IF3; IR, infrared; MST, Microscale Thermophoresis; (p)ppGpp, guanosine tetra- and pentaphosphate; RelA, (p)ppGpp synthase RelA; SpoT, Bifunctional (p)ppGpp synthase/hydrolase SpoT; tRNAi, initiator tRNA.

