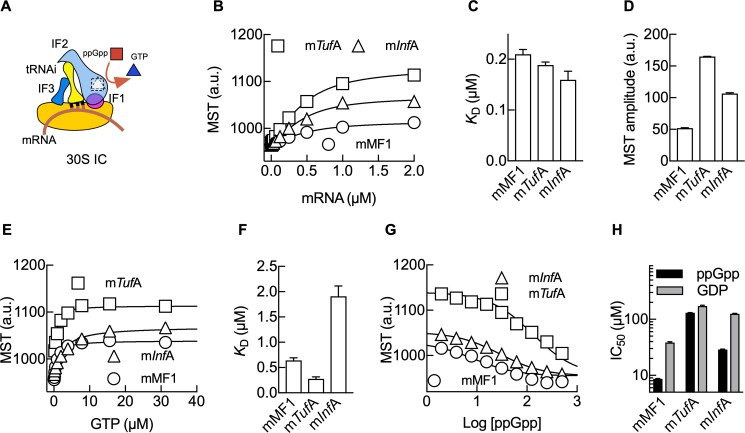
Fig 3. MST analysis shows an mRNA dependence of 30S IC formation.
(A) Scheme of the 30S IC highlighting ppGpp (red square) and GTP (blue triangle) competition for IF2. (B) MST dependence on the mRNA concentration for mTufA (squares), mInfA (triangles), or model messenger mMF1 (circles). MST was calculated from the respective fluorescence time dependencies (S3 Fig). Comparison of the resulting KD (C) and MST amplitudes (D) as an indicator of the efficiency of 30S IC formation for all three mRNAs. (E) Formation of 30S IC with increasing concentrations of GTP for the three mRNAs. Symbols as in (B). (F) Comparison of KD values calculated from (E). (G) ppGpp to GTP competitive assays for 30S IC formation. The 30S ICs formed with each mRNA (symbols as in B) in the presence of 50 μM GTP were subjected to increasing concentrations of ppGpp. Log of competitor concentrations is plotted and used for determining the inhibitory concentration for 50% inhibition (IC50) using a same-site competition model. (H) Bar graph comparing IC50 values for ppGpp (black) or GDP (gray) for all three mRNAs (S4 Fig). Continuous lines indicate nonlinear regression fittings with quadratic (B and E) or same-site competition (G) functions. Three measurements were performed; mean and standard deviations are plotted (S1 Data). GDP, guanosine diphosphate; GTP, guanosine triphosphate; IC, initiation complex; IF1, translation initiation factor IF1; mInfA, InfA mRNA; MST, Microscale Thermophoresis; mTufA, TufA mRNA; tRNAi, initiator tRNA.

