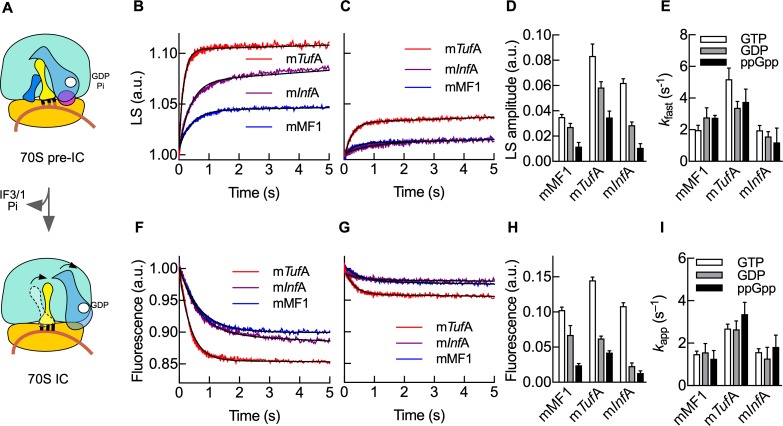
Fig 4. Kinetic parameters of ppGpp-mediated regulation of 70S IC progression.
(A) Scheme of 70S IC formation. The 30S complexes programmed with mTufA (red), mInfA (purple), or mMF1 (blue) and 20 μM GTP in the absence (B) or presence (C) of 200 μM ppGpp were mixed with 50S subunits. Time traces were analyzed by nonlinear regression with exponential terms. (D) Bar graph comparing amplitudes in the absence of any competing nucleotide (white) or in the presence of ppGpp (black) or GDP (gray). (E) Bar graph comparing apparent rates of 70S pre-IC formation (colors as in D). Formation of 70S IC, as measured by Bpy-tRNAi accommodation in the absence (F) or presence of 200 μM ppGpp (G). Time traces were analyzed by nonlinear regression with one exponential term. (H) Bar graph comparing amplitude variations as a function of mRNAs and guanosine nucleotides (colors as in D). (I) Bar graph comparing apparent rates of 70S IC formation for all three mRNAs (bar colors as in D). Continuous lines show best fits using an exponential function for a single reaction step. All time traces are mean values of 5 to 10 replicates. Bar graphs show mean and standard errors (error bars) derived from the nonlinear regression fitting (D,E,H,I) (S1 Data). Bpy-tRNAi, Bodipy labelled initiator tRNA; GDP, guanosine diphosphate; GTP, guanosine triphosphate; IC, initiation complex; IF3, translation initiation factor IF3; LS, light scattering; mInfA, InfA mRNA; mTufA, TufA mRNA.

