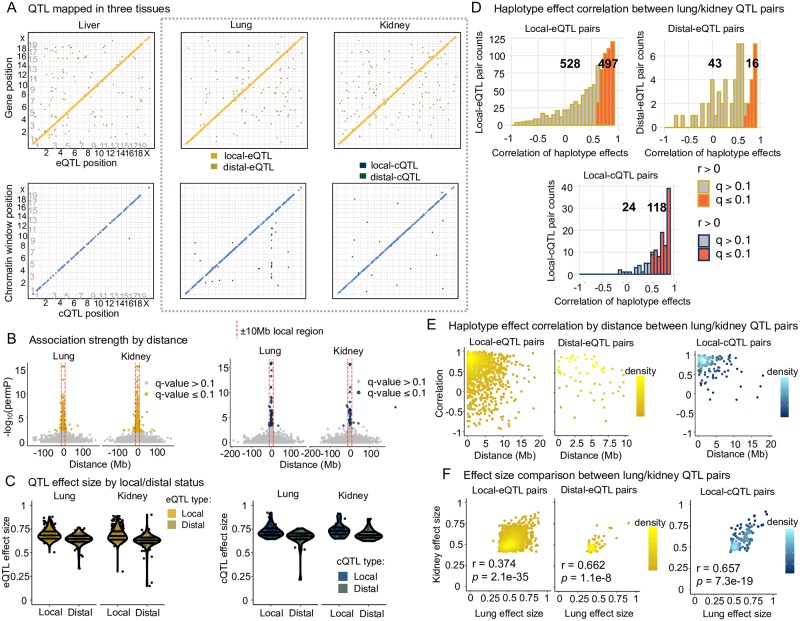
Fig 2. QTL mapping results and comparison of matched pairs from lung and kidney.
(A) Detected QTL are largely local for both gene expression and chromatin accessibility. QTL detected through all analyses, excluding intra-chromosomal distal-QTL detected through Analysis C, are included. The y-axis represents the genomic position of the gene or chromatin site, and the x-axis represents the genomic position of the QTL. Local-QTL appear as dots along the diagonal and distal-QTL as off-diagonal dots. The gray dashed box highlights lung and kidney QTL results, which are further explored in B-F. (B) Highly significant QTL map nearby the gene TSSs and chromatin window midpoints. Results from Analysis G are shown here. The red dashed line represents ± 10Mb from the trait genomic coordinate used to classify a QTL as local or distal. See S6 Fig for all tissues as well as results from Analysis C. (C) Local QTL have larger effect sizes than distal. Only results from Analysis G are included here. See S7 Fig for all tissues and results from Analysis C. (D) Consistent genetic regulation of gene expression and chromatin accessibility was observed between lung and kidney tissue, based on an enrichment in positively correlated founder haplotype effects for QTL paired across the two tissues. QTL from all the Analyses were considered here. See S10 Fig for all tissue pairings. (E) QTL observed in both lung and kidney that are highly correlated tend to map close to each other, consistent with representing genetic variation active in both tissues. See S11 Fig for all tissue pairings. (F) The effect sizes of QTL paired from lung and kidney are significantly correlated. See S9 Fig for all tissue comparisons.

