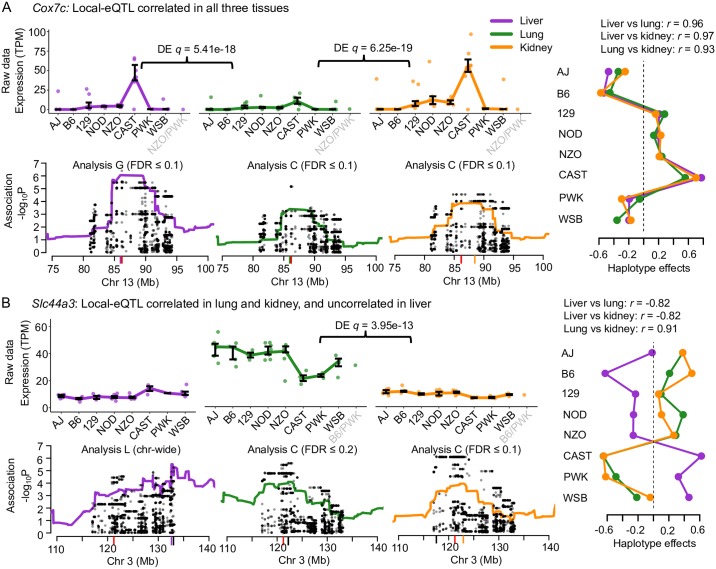
Fig 3. Examples of genes with local-eQTL observed in all three tissues.
(A) Cox7c possesses local-eQTL with highly correlated haplotype effects across all three tissues, supportive of shared causal origin. (B) Slc44a3 has a more complicated pattern of local-eQTL haplotype effects across the tissues, with correlated effects shared between lung and kidney, and transgressive effects in the liver eQTL by comparison, consistent with distinct causal variants comparing liver to lung and kidney. For both genes, the expression data are plotted with bars representing the interquartile ranges of the most likely founder haplotype pair (diplotype). Differential expression between tissues is highlighted. The haplotype association for each tissue is also included near the gene TSS with variant association overlaid. The most statistically rigorous method that detected the QTL (Analysis L, C, or G) is also included. The red tick represents the gene TSS, the black tick represents the variant association peak, and the colored tick represents the haplotype association peak. Haplotype effects, estimated as constrained best linear unbiased predictions (BLUPs).

