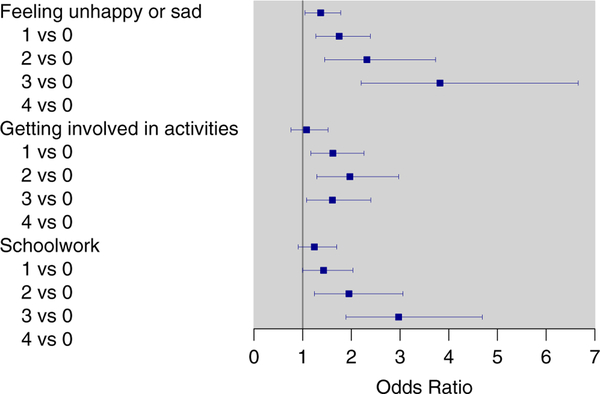
Figure 1.
Odds Ratios and 95% Confidence Intervals of Chronic Absenteeism for Columbia Impairment Scales Note. Higher score indicates a greater impairment (0= no problem, 4 = a very big problem). The model was adjusted for age, race/ethnicity, income, insurance, spoken language at home, asthma medication, less healthy than other child, and family size. The c-statistic was 0.79.

