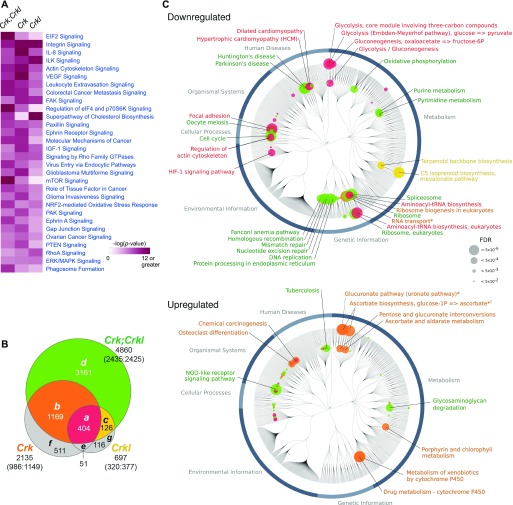
Figure 3. Crk and Crkl deficiencies affect numerous pathways.
(A) The heat map shows a list of the top 30 pathways based on comparison analysis of the Crk and/or Crkl single and double deficiency groups in Ingenuity Pathway Analysis (QIAGEN; see Supplemental Data 1 (30KB, xlsx) ). RNA-Seq experiments were performed on RNA isolated from four independent primary MEF populations for each genotype as described in the Materials and Methods section as well as in Table S2 and Supplemental Data 1 (30KB, xlsx) . Differentially expressed genes (DE genes) were identified by Benjamini–Hochberg adjusted P-values (p.adj) smaller than 0.05 using DESeq2. (B) Deficiencies for Crk and Crkl genes, separately or combined, resulted in overlapping lists of DE genes, categorized into subsets a-g as shown in the Venn’s diagram. Subsets a, b, c, and d are referred to subsets “red,” “orange,” “yellow,” and “green” hereafter (Supplemental Data 2 (322.5KB, xlsx) ). The number in each subset indicates the number of DE genes in the subset. The number below the gene symbol (Crk, Crkl, or Crk;Crkl) indicates the total number of DE genes identified in the gene deficiency. The numbers in parentheses separated by colon show the numbers of genes up-regulated versus down-regulated. Note that deficiency of either Crk or Crkl was sufficient to disrupt normal expression of the genes in subset “red,” whereas the genes in subset “green” tolerated single gene disruption of either Crk or Crkl. (C) The DE genes in subsets “red,” “orange,” “yellow,” and “green” were analyzed for their enrichment into pathways using KEGG (Kyoto Encyclopedia of Genes and Genomes). The node circles and annotations are color-coded as appeared in panel (B). Nodes are labeled only for the KEGG modules and pathways with Storey’s q-values smaller than 0.0005 (shown as FDRs), whereas node circles are shown for the pathways/modules with a q-value < 0.05. The diameter of node circle is proportional to −log10(q-value).

