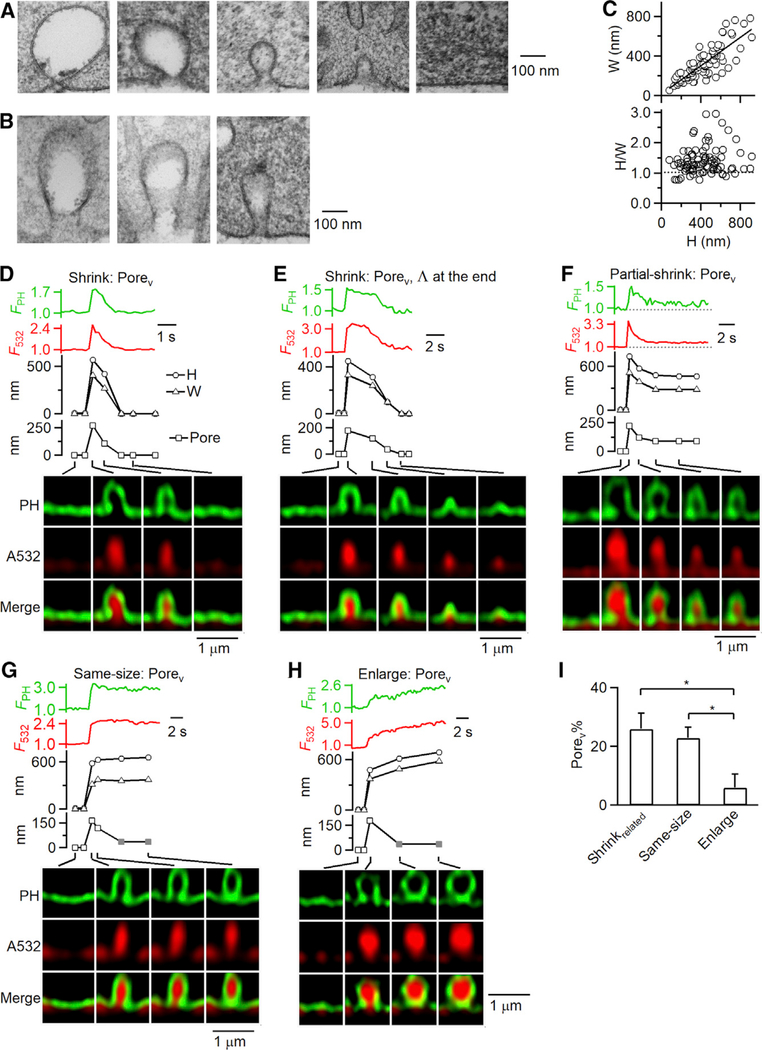
Figure 3. Fusion Pore Dynamics during Shrink, Partial Shrink, Same-Size, and Enlarge Fusion.
(A and B) Electron microscopic images of Ω-profiles (A) or elongated Ω-profiles resembling cylinders (B) with different sizes. Cells were in 70 mM KCl for 90 s.
(C) The width (W) and the ratio between the height (H) and width (H/W) of Ω-profiles observed with EM (each circle: 1 Ω-profile; 84 Ω-profiles from 800 cell cross sections). The line (upper panel) is a linear regression fit (correlation coefficient: 0.81). Dotted line (lower panel) indicates H/W = 1.
(D–H) FPH (PH-Ω fluorescence), F532 (A532 fluorescence), H (PH-Ω height, circles), W (PH-Ω width, triangles), pore (PH-Ω pore size, squares), and sampled images at times indicated with lines showing pore dynamics during shrink fusion (D and E), partial shrink fusion (F), same-size fusion (G), and enlarge fusion (H). Gray squares (G and H), pore remained open, but below our STED resolution of ~60 nm.
(I) The percentage of observing a Porev (Porev%, mean + s.e.m.) during shrinkrelated fusion (including shrink fusion and partial shrink fusion), same-size fusion, and enlarge fusion (total fusion event number: 236; from 202 cells). *p < 0.05, ANOVA test.
See also Figure S3.

