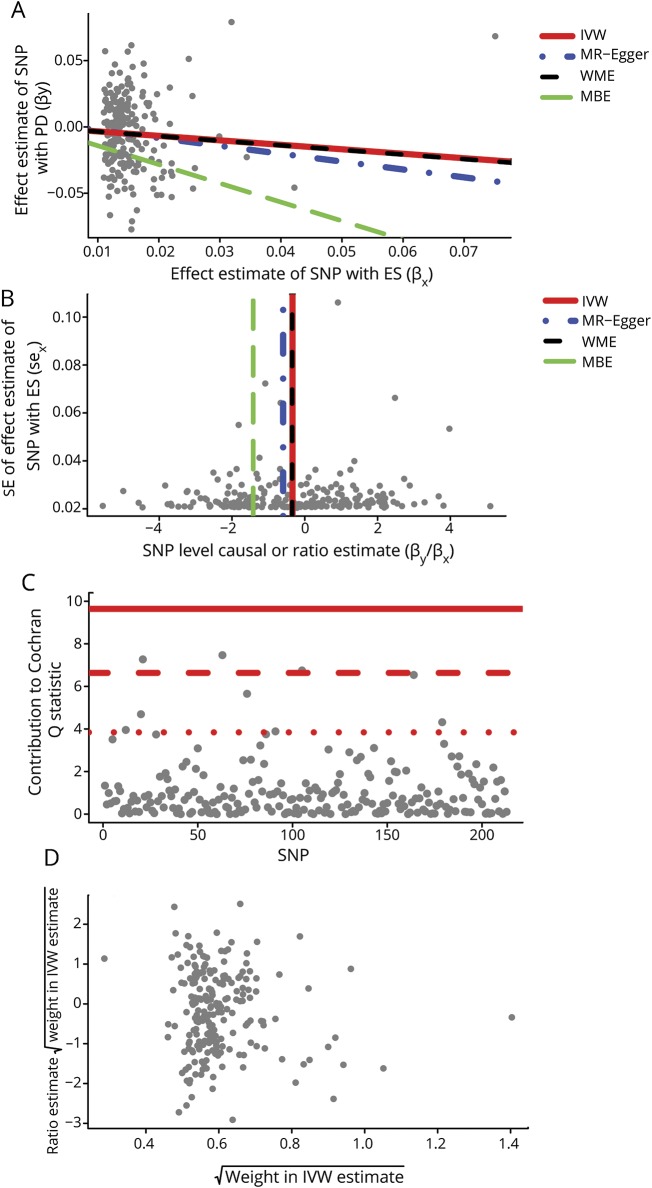
Figure 1. Causal association analysis and assessment of pleiotropy for the ever smoking phenotype with PD.
(A) Scatterplot showing causal effect estimates computed with various mendelian randomization (MR) methods. (B) Funnel plot showing the extent of heterogeneity among the individual Wald ratio estimates. (C) Plot of Cochran Q estimates for individual single nucleotide polymorphisms (SNPs) constituting the genetic instrument for ever smoker (ES) phenotype using inverse variance weighted (IVW) method using second-order weights. (D) Radial MR plot showing the distribution of weights contributed by individual SNPs in the causal effect estimation by IVW method using second-order weights. MBE = mode-based estimate; PD = Parkinson disease; SE = standard error; WME = weighted median estimate.

