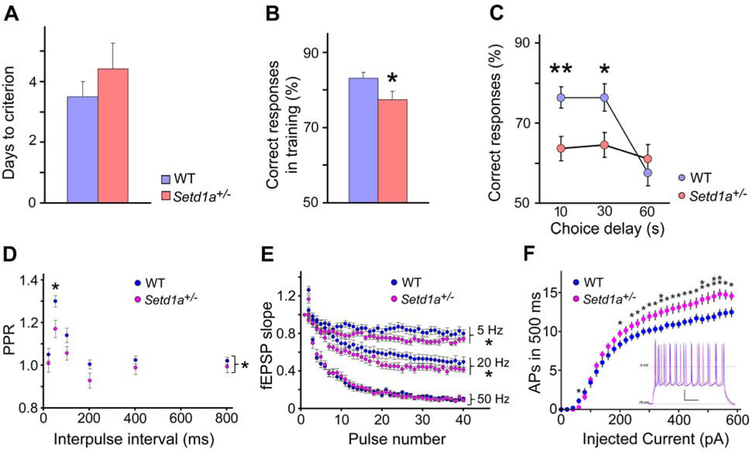
Figure 1. Setd1a deficiency impairs WM and alters neuronal short-term plasticity and excitability in PFC.
(A) Days taken to reach criterion on the DNMTP T-maze task. P = 0.36.
(B) Correct responses during training on the DNMTP T-maze task . P = 0.041.
(C) WM performance in a DNMTP task. Mean percentage of correct responses for WT and Setd1a+/− mice. Vertical axis starts at 50%, which represents response accuracy expected by chance. P = 0.0038 (10 sec), 0.0172 (30 sec), 0.485 (60 sec). *P < 0.05, **P < 0.01. Student’s two-tailed t-test, N = 12 per genotype (A, B, C).
(D) PPR is significantly decreased in Setd1a+/− mice when tested at various ISIs (20, 50, 100, 200, 400 and 800 ms), compared to WT mice (Bonferroni posttests revealed a significant difference at ISI of 50 ms, P < 0.05).
(E) Frequency-dependent differences of STD of the fEPSPs in WT and Setd1a+/− mice at 5 Hz, 20 Hz and 50 Hz. At 5 and 20 Hz, the STD is significantly greater in Setd1a+/− mice compared to WT controls. At 50 Hz, the STD is similar between genotypes . *P < 0.05, **P < 0.01.
(F) Summary data of number APs evoked in response to 500 ms currents steps. WT recordings, blue; Setd1a+/− recordings, magenta. Starred data represent results of pair-wise t-test comparisons at given current steps: * P < 0.05, ** P < 0.01. Inset; Setd1a+/− neurons display enhanced excitability (magenta) compared to WT neurons (blue). Representative traces from current-clamp recordings from L2/3 PNs showing AP responses to near-maximal current step (500 pA, 500 ms). Scale bar: 20 mV, 100 ms. Reference levels, Vrest = −70 and 0 mV.
Histograms show means and error bars s.e.m.

