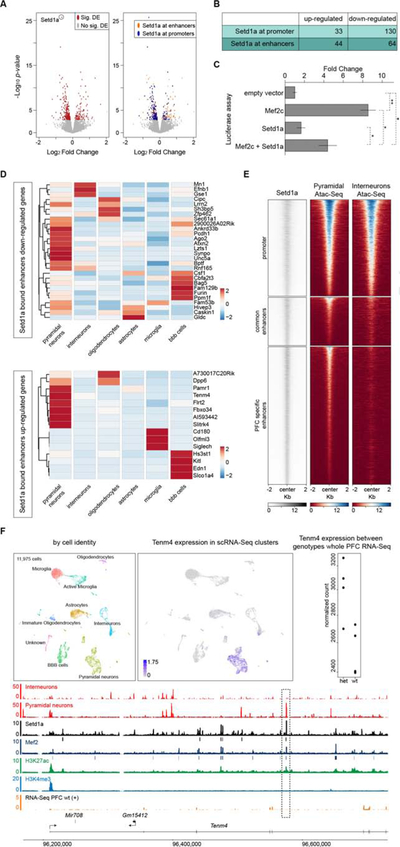
Figure 5. Differentially expressed genes in PFC of Setd1a+/− mice and cell-type specific expression of Setd1a target genes.

(A-B) Volcano plots of differentially expressed genes in whole-PFC RNA-Seq of Setd1a+/− mice are depicted in (A). 342 differentially expressed genes (FDR<5%) are shown in red, while non-significant changes are shown in grey (left panel). Of the 342 differentially expressed genes, 271 are Setd1a targets (orange and blue, right panel). We partitioned these genes in 4 categories based on the binding regions of Setd1a in the PFC. We defined ‘Setd1a bound promoters up-regulated genes’ and ‘Setd1a bound promoters down-regulated genes’ as genes in which promoters are bound by Setd1a. We defined ‘Setd1a bound enhancers up-regulated genes’ and ‘Setd1a bound enhancers down-regulated genes’ as genes in which enhancers, but not promoters, are bound by Setd1a. Genes with Setd1a binding at both promoters and enhancers, were partitioned into the “Setd1a-promoter bound” classes. A summary of the number of genes in each category is shown in (B).
(C) Luciferase reporter assay of Mef2 responding element when Mef2c and/or Setd1a are co-transfected transiently in HEK293T cells. While Mef2c transfected alone showed 8.5-fold increase activity over the background, when Mef2c is co-transfected with Setd1a, we observed a significant decreased activity (4.5-fold over background). Values are mean ± standard error for three biological replicates, normalized to the empty vector. Student’s t-test, *P < 0.05, **P < 0.01.
(D) Heatmaps of the expression levels of down-regulated (top panel) and up-regulated (bottom panel) genes with Setd1a bound enhancers, across different cell types identified by scRNA-Seq (see methods and Figure S6C and S6D). For this analysis we combined the two different identified types of microglia and oligodendrocytes. Heatmaps show the normalized UMI counts per genes of two biological replicates per genotype.
(E) Heatmap of Setd1a ChIP-Seq coverage and ATAC-Seq of sorted PNs and INs, 2 kilobases upstream and downstream of the center of Setd1a bound promoters (top) and enhancers (bottom). Heatmaps are sorted in the same order, based on the Setd1a signal.
(F) Tenm4 locus. UMAP representation of 11,975 single cell transcriptomes from the PFC of WT (5,944) and Setd1a+/− (6,031) mice, colored by the identified cell-types (see Methods, Figure S5C and S5D), is shown on the top-left panel. Tenm4 is specifically expressed in the scRNA-Seq PN cell cluster (top-middle panel) while whole PFC RNA-Seq showed that Tenm4 is up-regulated in Setd1a mutant mice (top-right panel; each dot is the normalized expression of Tenm4 in each biological replicate per genotype). Representative RNA-Seq data of one biological replicate of WT mice (orange), ChIP-Seq of Mef2 (dark blue), Setd1a (black), H3K27ac (green), H3K4me3 (light blue) as well as ATAC-Seq from PNs and INs (light red) are shown (bottom panel). Black and dark blue boxes below Setd1a and Mef2 tracks respectively, represent significant peaks that passed all quality checks (see Methods). Highlighted with a dashed square is the regulatory element that is bound by Setd1a and Mef2, marked by H3K27ac but not by H3K4me3, and accessible in PNs but not in INs.
