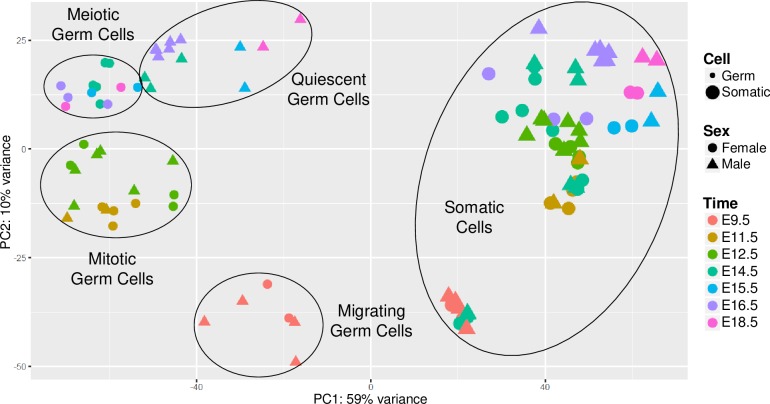
Fig 1. A comprehensive RNA-seq time course dataset from Sangrithi et al. in the cells of the embryonic gonad [19].
PCA plot of the reprocessed mouse RNA-seq data. Somatic and germ cell lineages (dot size) are separate on the plot, germ cells group together depending on stage of development (dot color) and later by sex (dot shape).

