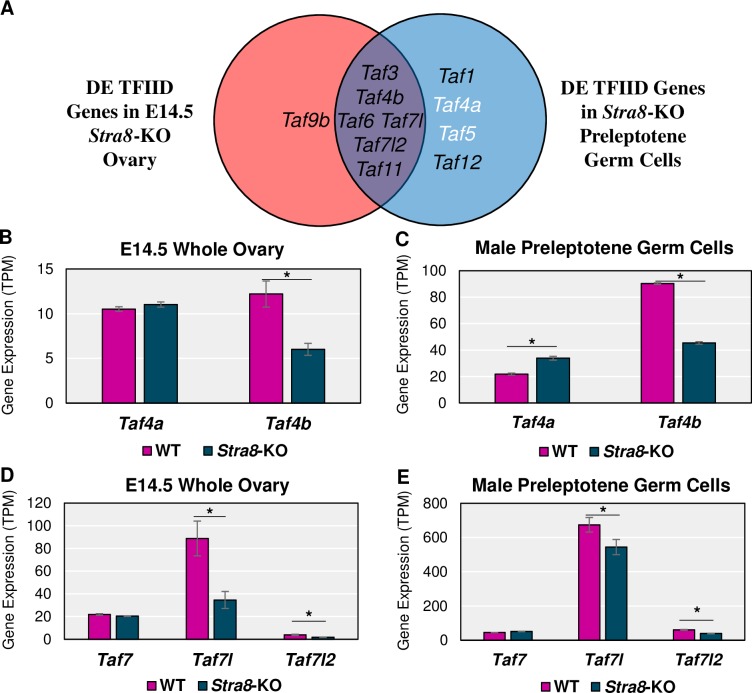
Fig 7. TFIID subunits in Stra8-KO female and male mice.
(A) Venn diagram of TAFs found to be significantly (log2FC > |0.25|, p-adj < 0.05) different between the WT and Stra8-KO of the E14.5 ovary and/or male preleptotene germ cells. Black text indicates decreased mRNA expression in the Stra8-KO and white text indicates increased mRNA expression in the Stra8-KO compared to WT. Gene expression levels of Taf4a versus Taf4b in female (B) and male (C) WT versus Stra8-KO RNA-seq experiments. Gene expression levels of Taf7, Taf7l, and Taf7l2 in female (D) and male (E) WT versus Stra8-KO experiments (* = log2FC > |0.25|, p-adj. < 0.05). Error bars indicate ± SEM.

