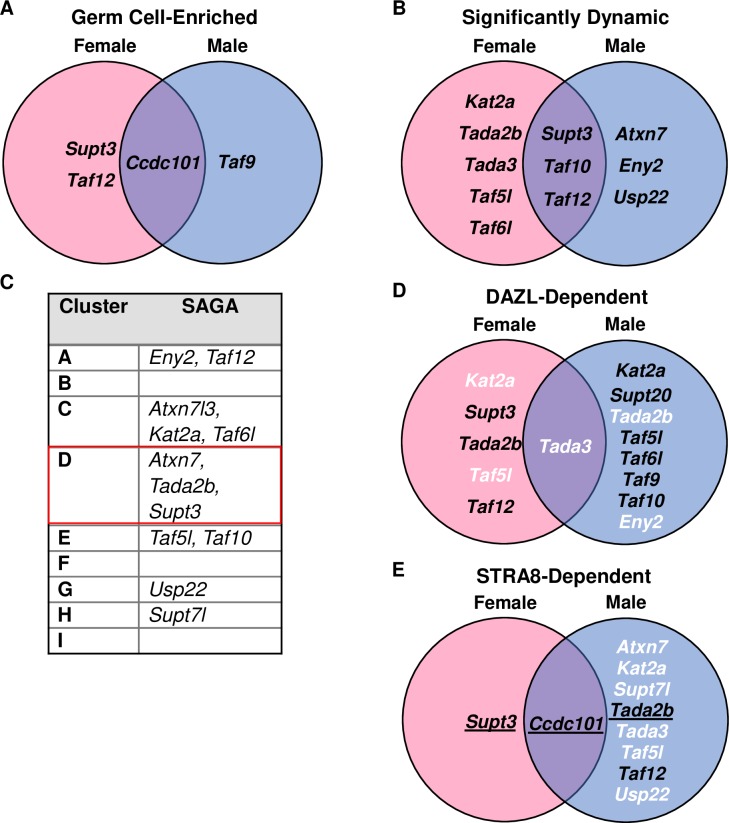
Fig 10. SAGA complex components not particularly germ cell relevant.
(A) Venn diagram of SAGA subunits identified as significantly germ cell-enriched in the female and/or male germ cell time course data. (B) Venn diagram of SAGA subunits identified by ImpulseDE2 as significantly dynamic in the female and/or male germ cell time course data. (C) SAGA complex subunits that were part of the top 10,000 most variable genes in the k-means clustering. (D) Venn diagram of SAGA subunits found to be significantly (log2FC > |0.25|, p-adj < 0.05) different between the WT and Dazl-KO of the E14.5 ovary and/or PND6 spermatogonia. Black text indicates decreased mRNA expression in the Dazl-KO and white text indicates increased mRNA expression in the Dazl-KO compared to WT. Underlined text indicates the gene was found to have DAZL binding in its 3’ UTR in 2 out of 3 DAZL iCLIP replicates. (E) Venn diagram of SAGA found to be significantly (log2FC > |0.25|, p-adj < 0.05) different between the WT and Stra8-KO of the E14.5 ovary and/or male preleptotene germ cells. Black text indicates decreased mRNA expression in the Stra8-KO and white text indicates increased mRNA expression in the Stra8-KO compared to WT. Underlined text indicates peaks at transcription start sites detected in two of three ChIP-seq replicates.

