. 2020 Jan 15;9:e50267. doi: 10.7554/eLife.50267

Figure 2. Analysis of the TCGA pan-cancer dataset and clustering by tumor type.

CNApp outputs to characterize pan-cancer 10,635 samples including 33 TCGA cancer types. (A) Broad, Focal and Global CNA scores (BCS, FCS and GCS, respectively) distribution across the 33 cancer types (Figure 2—source data 1). (B) Genome-wide chromosome arm CNA profile heatmap for 10,635 samples considering broad and focal events. Annotation tracks for FCS, BCS and GCS are presented. (C) Arm regions frequencies as percentages relative to the TCGA pan-cancer dataset (red for gains and blue for losses). (D) Heatmap plot showing 20 out of the 33 TCGA cancer type profile correlations, by Pearson's method, hierarchically clustered by tissue of origin. Gastrointestinal, gynecological and squamous cancers are clustering consistently in their respective groups.

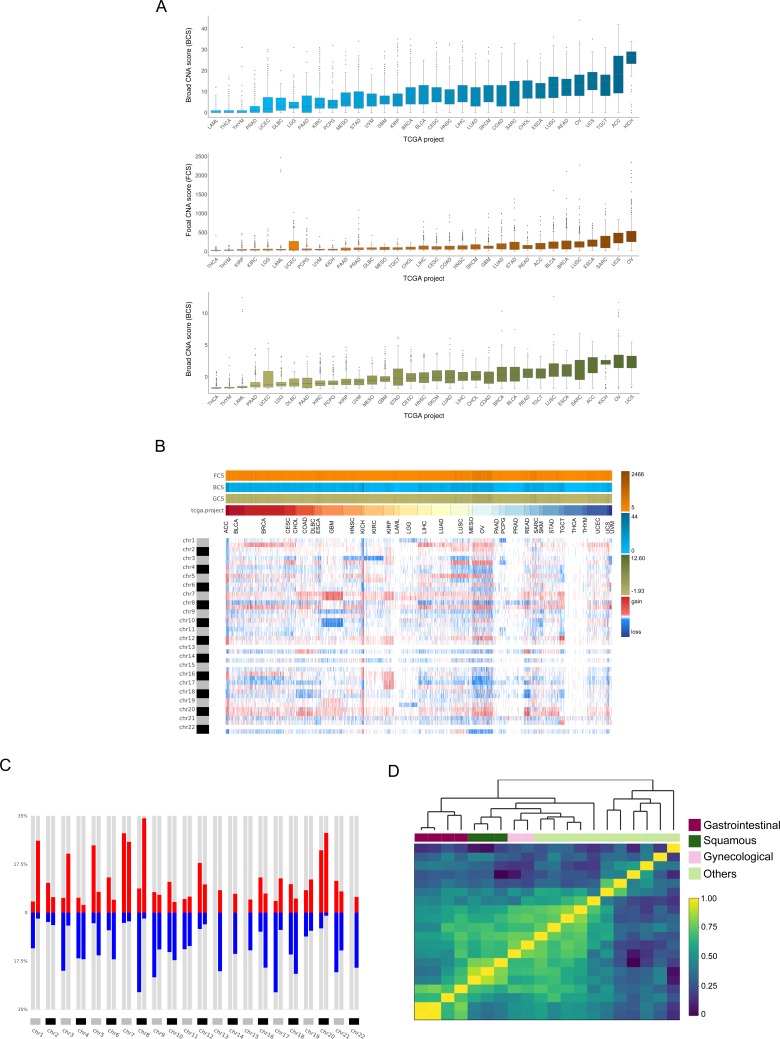
Figure 2—source data 1. Broad, Focal and Global CNA scores across the pan-cancer cohort.
elife-50267-fig2-data1.xlsx (309.7KB, xlsx)

Figure 2.

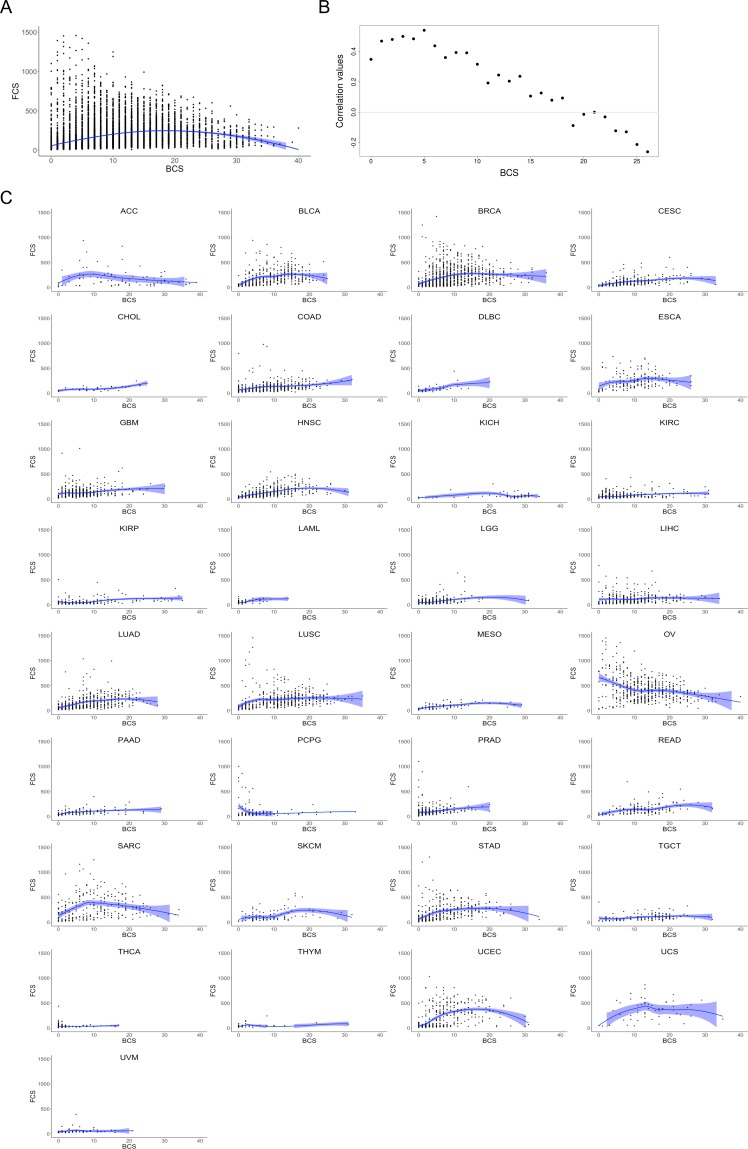
Figure 2—figure supplement 1. Correlation plots between FCS and BCS.

Figure 2—figure supplement 1.

(A) BCS values (x-axis) and FCS values (y-axis) scatterplot for 10,635 samples from pan-cancer cohort. Scatterplot smoothing by loess regression curve (in blue) and confidence interval. (B) Correlation plot showing broad and focal CNA score values for the TCGA pan-cancer dataset. Spearman’s rank correlation test between broad and focal CNA scores (BCS and FCS, respectively) was performed. Sample subsets were computed by selecting 500 random samples from those displaying BCS ±5 for each BCS value. Values of BCS and FCS for each subset of samples were correlated. (C) Scatterplots for the 33 cancer types with BCS values (x axis) and FCS values (y axis) in samples. Scatterplot smoothing by loess regression curve (in blue) and confidence interval. (TIFF 3.7 MB).
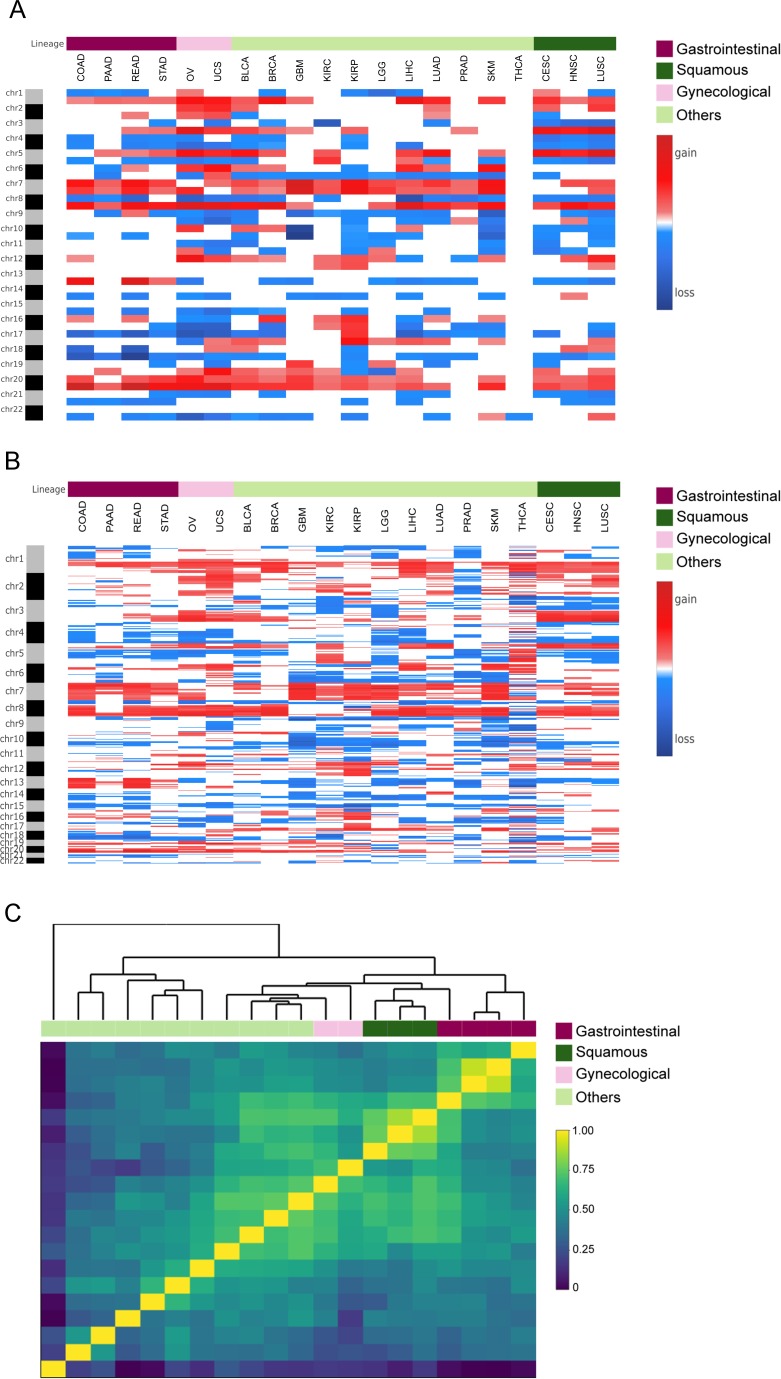
Figure 2—figure supplement 2. Clustering analysis between cancer types.

Figure 2—figure supplement 2.

(A) Heatmap analysis showing mean chromosome arm region profiles taking into account both broad and focal alterations, spanning 20 cancer type, for 8653 samples from the TCGA pan-cancer dataset. Cancer types were indicated in the column ID from the input file. Annotation track displays tumor types, including squamous cell carcinomas, gynecological cancers, gastrointestinal cancers, and others. (B) Heatmap analysis showing mean 5 Mb region profiles taking into account only focal alterations, spanning 20 cancer type, for 8653 samples from the TCGA pan-cancer dataset. Cancer types were indicated in the column ID from the input file. Annotation track displays tumor types, including squamous cell carcinomas, gynecological cancers, gastrointestinal cancers, and others. (C) Heatmap plot showing 20 out of the 33 TCGA cancer type profile (by 5 Mb genomic regions and accounting only for focal alterations) correlations, by Pearson's method, hierarchically clustered by tissue of origin. Gastrointestinal, gynecological and squamous cancers are clustering consistently in their respective groups. (TIFF 2.8 MB).