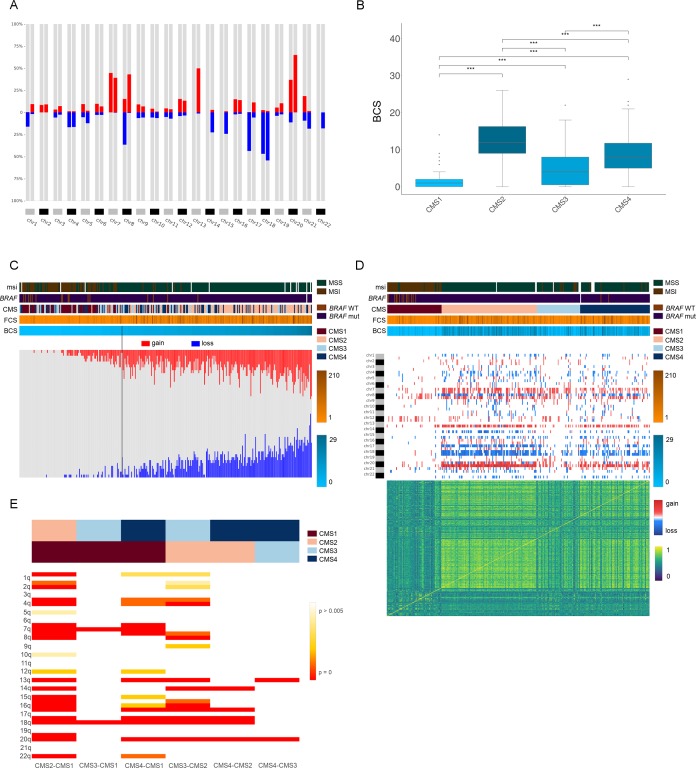
Figure 4. Genomic characterization of colon cancer according to the CMS classification.
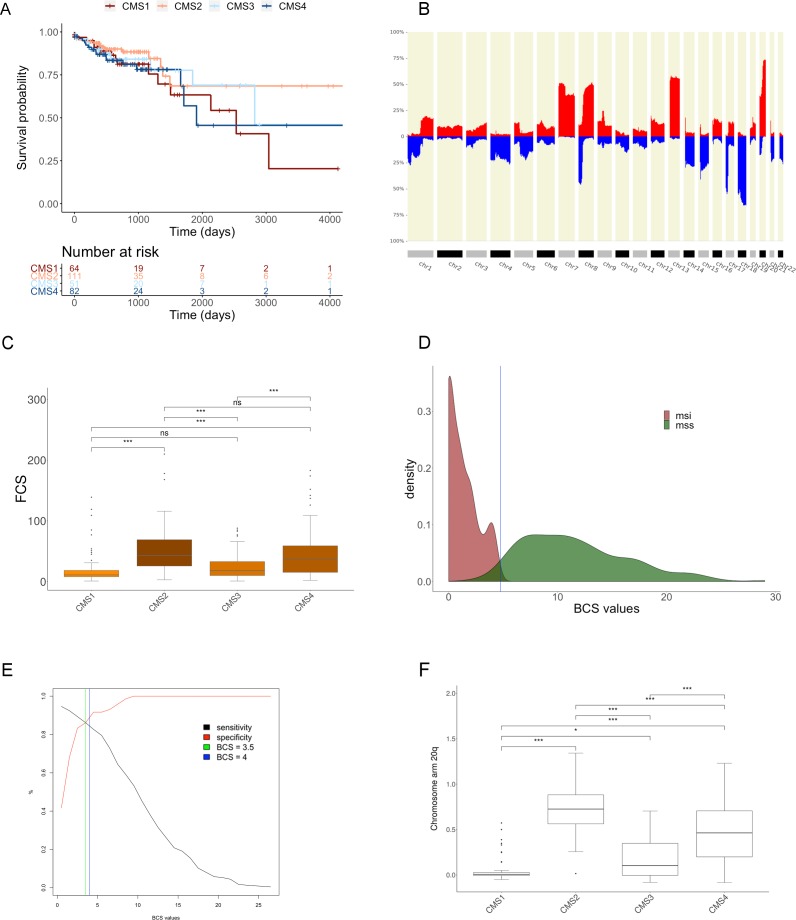
(A) Arm-region frequencies of 309 colon cancer samples using CNApp default thresholds for CNAs. (B) BCS distribution by CMS sample groups (Figure 4—source data 1). FCS distribution by CMS sample groups is presented in Figure 4—figure supplement 1C. Wilcoxon rank-sum test significance is shown as p-value≤0.001 (***); p-value≤0.01 (**); p-value≤0.05 (*); p-value>0.05 (ns). (C) Number of gained and lost chromosome arms for each sample distributed according to the BCS values. Note that a cutoff at four is indicated with a black line. Annotation tracks for microsatellite instability (msi), BRAF mutated samples (braf_mut), CMS groups (cms_label), FCS and BCS are displayed. (D) Genome-wide profiling by chromosome arms distributed according to the CMS group. Annotation tracks for microsatellite instability (msi), BRAF mutated samples (braf_mut), CMS groups (cms_label), FCS and BCS are displayed. Sample-to-sample correlation heatmap plot by Pearson’s method is shown below. (E) Differentially altered chromosome arm regions between CMS groups (CMS1, CMS2, CMS3 and CMS4). Heatmap plot displaying the significance between CMS groups paired comparisons. Student’s T-test was applied and multiple testing correction by BH method was used to assess differences in chromosome arm values between groups. Adjusted p-values are displayed.


