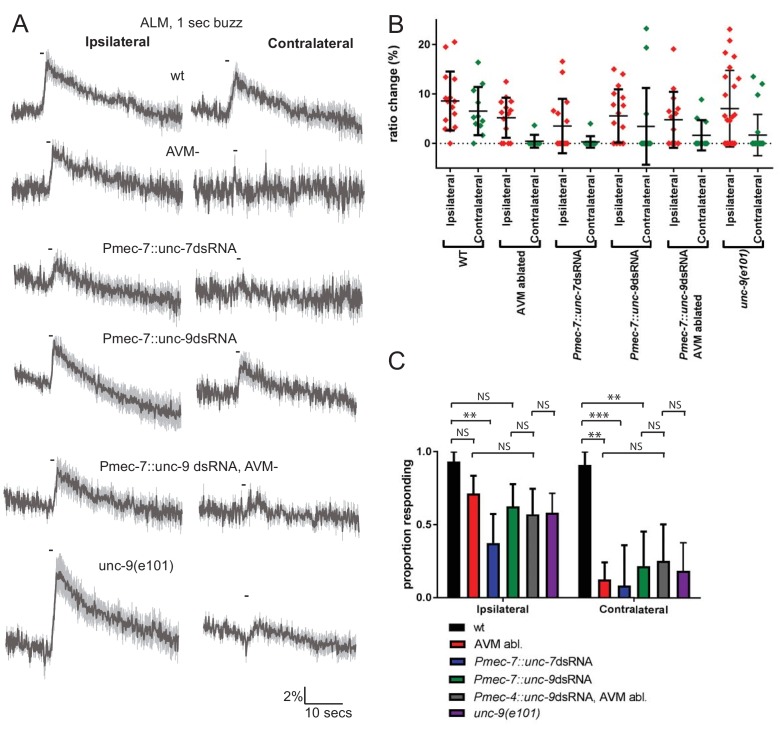
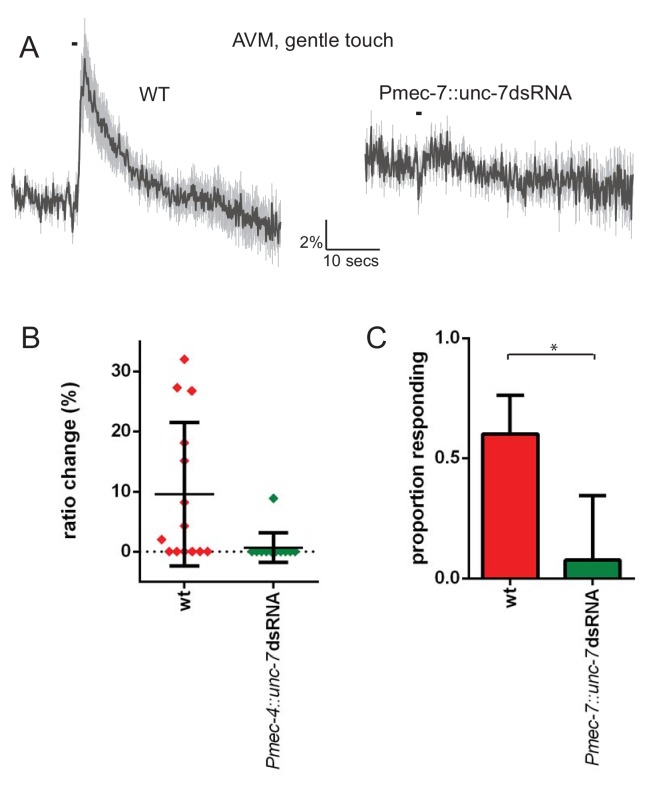
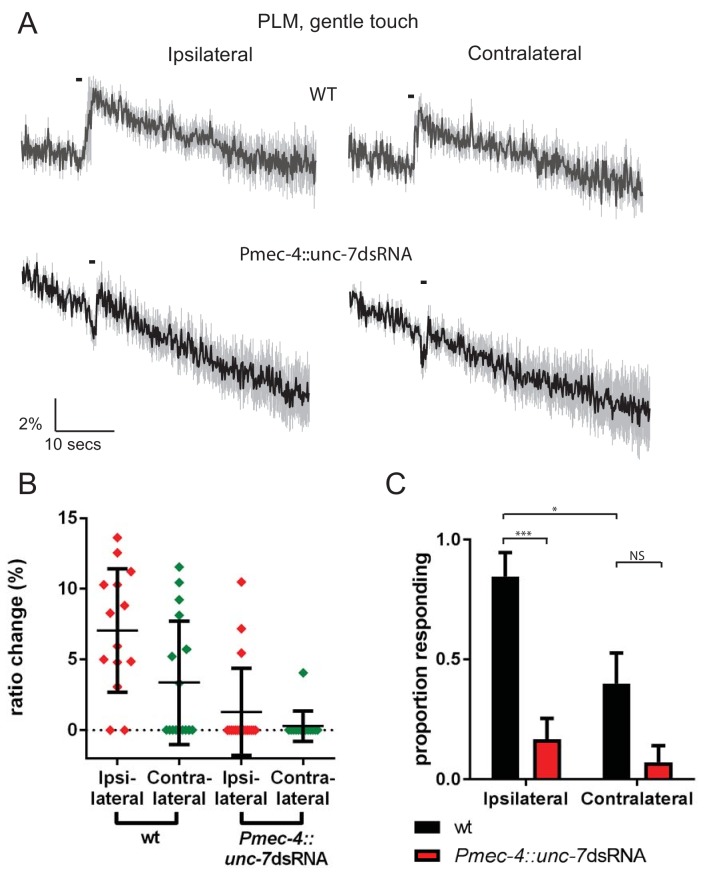
Figure 2. Innexins are required for mechanosensation and electrical coupling of touch neurons.
(A, B, C) Gentle touch responses recorded in ALM for wild type worms, worms in which AVM has been laser ablated and worms expressing dsRNA under control of Pmec-7. Neurons have been classified as ‘ipsilateral’ or ‘contralateral’, according to the position of the cell body relative to the stimulation site and the hypothetical midline of the animal. (A) Average traces of % ratio change. Gray indicates SEM. (B) Scatter plot showing individual ratio changes (diamonds). Bars indicate mean ± SEM. (C) Graph showing proportion exhibiting a Ca2+ response. Error bars indicate SE. In ipsilateral neurons, the proportion of AVM ablated animals (p=0.1686) or unc-9 RNAi animals (p=0.1686) responding is not significantly different to wild type, while unc-7 RNAi animals respond at a significantly reduced rate (p=0.0021). Combining unc-9 RNAi with AVM ablation is not significantly different from either unc-9 RNAi alone (p=0.7104), AVM ablation alone (p=0.6946) or unc-9(e101) (p=1). In contralateral neurons, the proportions of AVM ablated, unc-7 RNAi and unc-9 RNAi animals responding are all significantly lower than wild type (p=0.0012; p=0.0001; p=0.001). Combining unc-9 RNAi with AVM ablation is not significantly different from either unc-9 RNAi alone (p=1.0), AVM ablation alone (p=0.6027) or unc-9(e101) (p=0.661), Fisher’s exact test (N = 15, 14, 16, 16, 14, 24, 11, 8, 12, 14, 11, 22, in the order shown in C).


