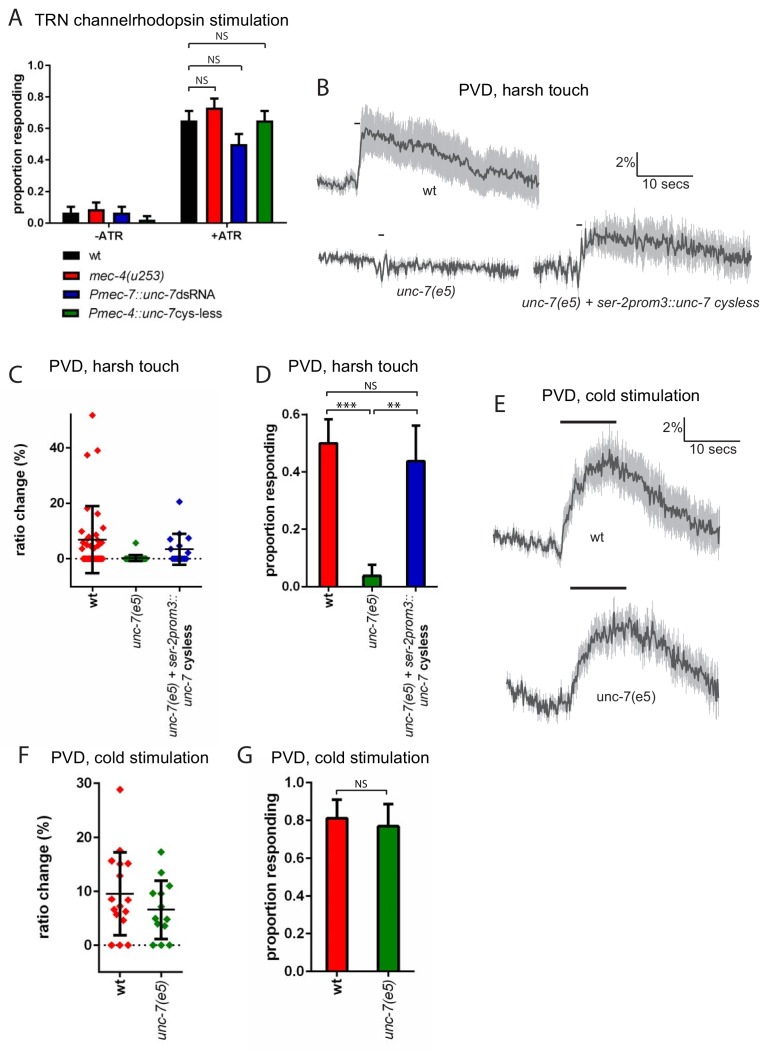
Figure 4. unc-7 is specifically required for mechanosensation.
(A) Behavioural response to light stimulation of animals expressing channelrhodopsin in the TRNs. The proportion of wild type animals responding was not significantly different to that for Pmec-7::unc-7dsRNA (p=0.1393), Pmec-4::unc-7 cysless (p=1) or mec-4(u253) (p=0.4294) animals (N = 45, 45, 45, 45, 60, 60, 60, 60). All these experiments were carried out in a lite-1 mutant background to eliminate effects of endogenous blue light responses (see strain list, Supplementary file 1). (B,C,D) Harsh touch responses recorded in PVD for wild type and unc-7(e5) animals. (B) Average traces of % ratio change. Gray indicates SEM. (C) Scatter plot showing individual ratio changes (diamonds). Bars indicate mean ± SEM. (D) Graph showing proportion exhibiting a Ca2+ response. Error bars indicate SE. The proportion responding is significantly reduced in unc-7(e5) animals (p<0.0001); and this is significantly rescued (p=0.0026) to a response rate not significantly different (p=0.7683) from wild type (N = 36, 26, 16). (E,F,G) Cold responses recorded in PVD for wild type and unc-7(e5) animals. (E) Average traces of % ratio change. Black bar indicates shift from 22°C to 15°C. Gray indicates SEM. (F) Scatter plot showing individual ratio changes (diamonds). Bars indicate mean ± SEM. (G) Graph showing proportion exhibiting a Ca2+ response. Error bars indicate SE. The proportion responding is not significantly different (p=1), Fisher’s exact test, N = 16, 13).

