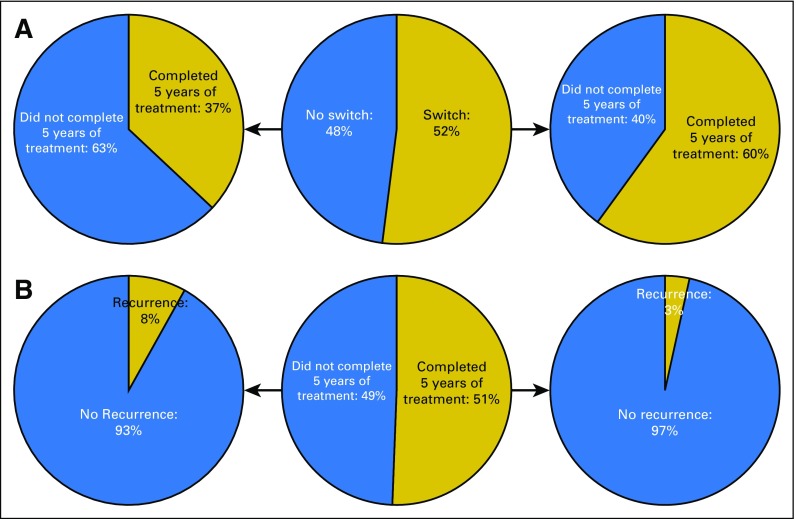
Fig 1.
(A) Rates of treatment completion in patients grouped by presence of a drug switch. The center circle represents the full patient cohort, and the marginal circles represent completion rates of the switch and no-switch subcohorts. (B) Rates of recurrence in patients grouped by 5-year treatment completion. The center circle represents the full patient cohort, and the marginal circles represent recurrence rates of the patients who did and did not complete 5 years of treatment.

