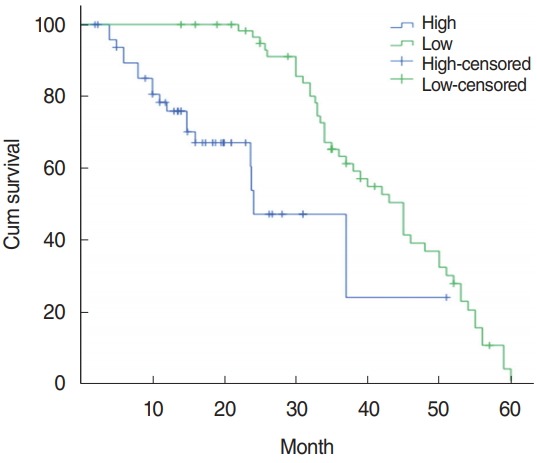
Fig. 3.

The survival curve of PTTG1 patients with high and low expression. Kaplan-Meier analysis of the total survival time of the PTTG1 high-expression group and the low-expression group showed that the total survival time of the PTTG1 high-expression group was significantly lower than that of the low-expression group, and the difference in total survival time between the two groups was significant (P<0.001).
