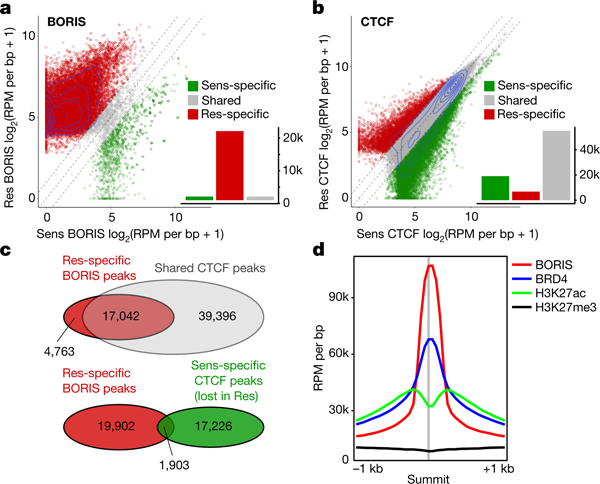
Fig. 2 |. BORIS overexpression is associated with its increased chromatin occupancy in resistant cells, whereas CTCF binding is unchanged.
a, Scatter plot of BORIS binding in sensitive (Sens) and resistant (Res) cells for all detected BORIS-binding sites. BORIS peaks unique to resistant cells (n = 21,805; 91%), sensitive cells (n = 1,125; 4.7%) and shared between the two cell types (n = 1,086; 4.5%) are shown. b, Scatter plot of CTCF binding in sensitive and resistant cells for all detected CTCF-binding sites. CTCF peaks unique to resistant cells (n = 6,808; 8.3%), sensitive cells (n = 19,129; 23.2%) and shared between the two cell types (n = 56,438; 68.5%) are shown. c, Overlap between BORIS peaks that are unique to resistant cells and CTCF peaks shared between resistant and sensitive cells (top), and between resistant cell-specific BORIS peaks and sensitive cell-specific CTCF peaks (bottom). d, Meta-analysis of average ChIP–seq signals at resistant cell-specific BORIS-binding sites. All panels, n = 2 biological replicates.

