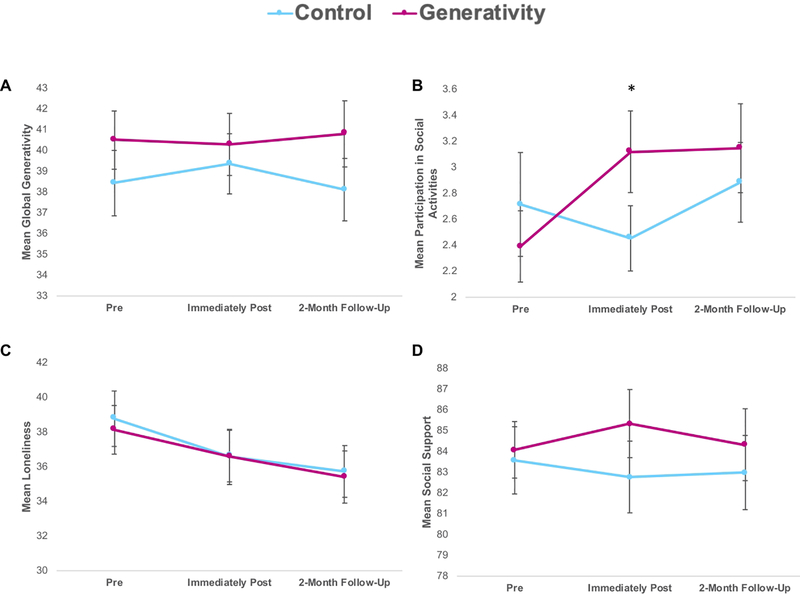
Figure 2.
Effects of the intervention on global feelings of generativity and social well-being in the generativity and control groups. Mean pre-intervention, immediately post-intervention, and 2-month follow-up scores are depicted for visual purposes; all analyses were ANCOVAs, examining differences between conditions on post-intervention values (for the primary aim) and differences between conditions on follow-up values (for the exploratory aim), controlling for pre-intervention values (and white/non-white race and age, if p < .1 as covariates). Mean values at pre-intervention, post- intervention, and 2-month follow-up shown for a) Loyola Generativity Scale (global feelings of generativity), b) Participation in social activities on the Lifestyle Activities Questionnaire, c) UCLA Loneliness Scale, and d) Total score on Social Provisions Scale. Error bars depict the standard error of the mean. Asterisk reflects p-value of p < .01 from the reported ANCOVA analysis.

