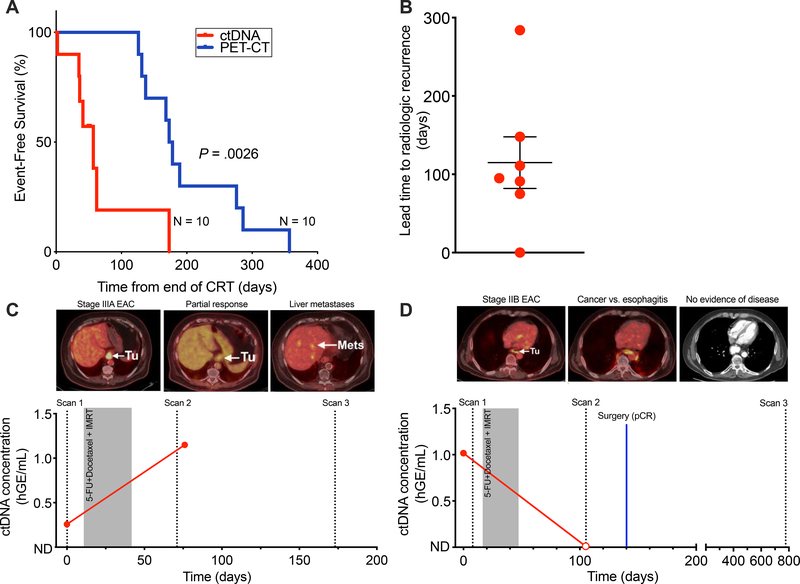
Figure 4. ctDNA allows earlier and more robust detection of recurrence compared to PET-CT imaging.
(A) Kaplan–Meier analysis for event-free survival (P = .0026), comparing ctDNA detection at the post-CRT time point with standard-of-care PET-CT imaging (n=10). Time to event (days) was measured from end of CRT. P values and hazard ratios (HR) were calculated from the log-rank test. (B) Column dot plot of the lead time to radiographic recognition of recurrence for ctDNA detection (n=7), with the bars representing mean (114.9) and standard error of the mean (32.9). (C) Patient (EP58) with stage IIIA EAC with partial response to CRT on surveillance imaging and a decrease in post-CRT MTV but had increased levels of ctDNA post-CRT and experiences distant liver metastasis. (D) Patient (EP29) with stage IIB EAC with equivocal surveillance imaging, increased post-CRT MTV, and undetectable post-CRT ctDNA who achieves long-term survival.

