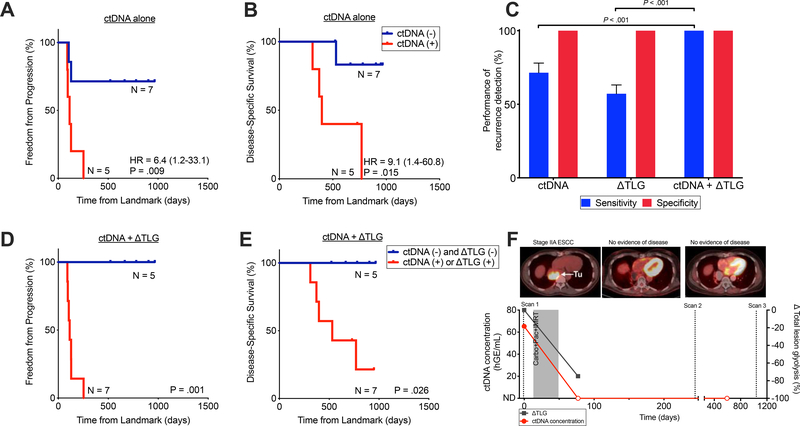
Figure 5. Integrating ctDNA and ΔTLG enables improves detection of recurrence among patients receiving CRT alone.
Kaplan–Meier analysis for (A) freedom from progression (P=.0093, HR 6.4 (95% CI 1.2–33.1)) and (B) disease-specific survival (P=.015, HR 9.1 (95% CI 1.4–60.8)) stratified by post-CRT ctDNA detection among patients receiving CRT alone (n=12). Time to event (days) was measured from post-CRT PET imaging. P values and hazard ratios (HR) were calculated from the log-rank test. (C)Mean sensitivity and specificity of ctDNA, ΔTLG, and both, for any recurrence detection (n=12). ΔTLG is defined as the percent change in TLG in response to CRT. Mean and standard deviation calculated using leave-one-out approach. P values calculated by the Mann-Whitney test. Kaplan–Meier analysis for (D) freedom from progression (P=.0011) and (E) disease-specific survival (P=.026) stratified by integration of ctDNA detection and ΔTLG at the post-CRT time point (n=12). Patients in the red curve (n=7) either had detectable ctDNA following CRT or had ΔTLG ≥ −48.5% while patients in the blue curve (n=5) had undetectable ctDNA after CRT and had ΔTLG < −48.5%. Time to event (days) was measured from post-CRT PET imaging. P values were calculated from the log-rank test. Hazard ratios are not reported as they are undefined given the absence of any events in the ctDNA and ΔTLG negative group. (F) Patient (EP34) with stage IIA ESCC treated with CRT-alone who achieved long-term survival with no evidence of disease. Patient had detectable ctDNA pre-treatment and remains undetectable following CRT.

