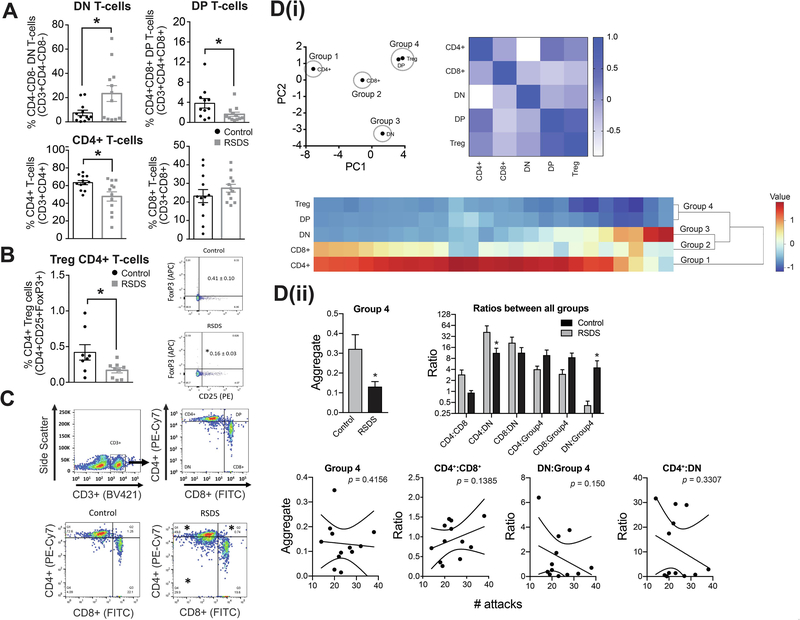
Figure 3: RSDS increases dual-negative (DN) precursor T-cell counts while decreasing dual-positive (DP), mature CD4+ T-cell counts and CD4+ Treg cells.
We tested whether RSDS alters the percentage of the T-cell count in peripheral blood (Methods). On the third day after the last session of RSDS or control handling, blood samples were processed with appropriate CD3 (pan T-cell marker), CD4 and CD8 antibodies and analyzed by flow cytometry. Respective isotype controls were run simultaneously to detect any non-specific immunological reactions. (A) Upper left panel: Percentage of DN T-cells are increased by RSDS compared to control. Control: N = 12 rats, 7.36 ± 2.25 %; RSDS: N = 12 rats, 23.35 ± 6.55 %; t = 2.307, df = 22, p = 0.03, unpaired t-test. Upper center-left panel: Percentage of DP T-cells are reduced by RSDS. Control: N = 11 rats, 3.79 ± 0.94; RSDS: N = 12 rats, 1.60 ± 0.42; U = 34, p = 0.04, Mann-Whitney U test. Center-right panel: Percentage of CD4+ T-cells are reduced by RSDS. Control: N = 12 rats, 63.39 ± 2.33 %; RSDS: N = 12 rats, 47.68 ± 5.24 %; t = 2.734, df = 22, p = 0.01, unpaired t-test. Right panel: Percentage of CD8+ T-cells are not altered, but shows a trend towards increase, by RSDS. Control: N = 12 rats, 23.16 ± 3.51 %; RSDS: N = 12 rats, 27.39 ± 2.11 %; t = 1.032, df = 22, p = 0.31, unpaired t-test. * indicates p < 0.05; unpaired t-test. Gating was done for each antibody based on the non-specific binding of the appropriate negative isotype stained controls. (B) The Treg cells have been defined as CD25+FoxP3+CD4+ T-cells. Left panel: There is a significant decrease of the Treg cells in RSDS group compared to the control (right); Control: N = 8 rats, 0.419 ± 0.108 %; RSDS: N = 9 rats, 0.167 ± 0.036 %; t = 2.316, df = 15, p = 0.03, unpaired t-test. Right panel: CD3+ T-cells have been gated to identify CD25+FoxP3+ cells. Gating was done for each antibody based on the non-specific binding of the appropriate negative isotype stained controls. (C) Upper panel (left and right): Gating strategy used during analysis of single cells by flow cytometry is shown. CD3+ labeled cells were gated as the T-cells, which were further differentiated into dual negative (DN, CD4− CD8−), dual positive (DP, CD4+ CD8+), CD4+ and CD8+ T-cells as shown in the four quadrants. The respective fluorophores used to tag the antibodies have been shown in the parenthesis along the axes. X-axis represents forward scatter while the y-axis indicates side scatter in the plot. Lower panel: Representative scatter plots showing the different population of T-cells after gating from control (left) and RSDS (right) groups. * indicates statistically significant difference (p < 0.05; unpaired t-test) from the respective cell population (RSDS vs. control). (Di) PCA analysis was used to group cell types (left). This was followed by correlation matrix to visually confirm that changes in grouped cell types were correlated (right; color bar indicates Pearson r value). The grouping was computationally confirmed with hierarchical clustering analysis (bottom). Based on this analysis, CD4+, CD8+, and dual negative (DN) cells were all independent, and were maintained in separate groups (Groups 1–3). However, dual positive (DP) and Treg cells were highly associated, and were clustered together (Group 4). (Dii) The effect of RSDS on each group was analyzed. Group 1–3 were all comprised of single cell types, so results were the same as (A). RSDS significantly decreased Group 4 (DP and Treg cells; left). The effect of RSDS on the balance between all groups was tested as the ratio between each group pairing. RSDS significantly shifted the balance away from Group 4, and towards DN cells. There was no significant correlation between number of attacks and Groups, nor any of the Ratios, after corrections for multiple comparisons (bottom; correlation examples key measures showns, all p > 0.05). Number of attacks indicates the total number of attacks received during the days of defeat. * indicates p < 0.05 vs. control. Data shown as mean ± S.E.M.

