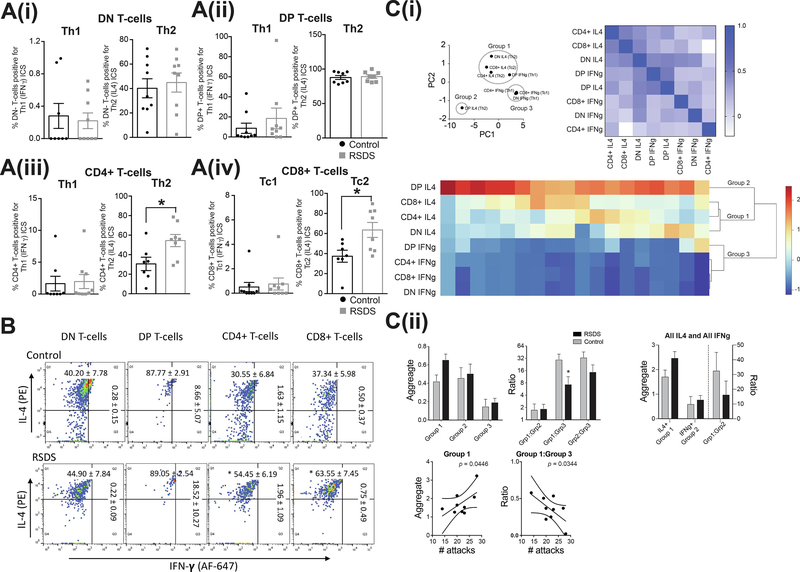
Figure 4: RSDS has no effect on the type 1 (Th1 and Tc1) - positive T-cell counts, but increases type 2 (Th2 and Tc2) - positive mature CD4+ and CD8+ T-cell counts in peripheral blood, in peripheral blood.
We tested whether RSDS alters the percentages of Th1 or Tc1 (IFN-γ) positive and Th2 or Tc2 (IL-4) positive T-cell count in peripheral blood. On the third day after the last session of RSDS or control handling, blood samples were processed with appropriate CD3 (pan T-cell marker), CD4, CD8, IFN-γ and IL-4 antibodies, and analyzed by flow cytometry. Respective isotype controls were run simultaneously to detect any non-specific immunological reactions (Methods). (A) Type 1 (Th1/Tc1) or type 2 (Th2/Tc2) intracellular cytokine staining (ICS) profile, measured by IFN-γ or IL-4 staining respectively, of the different T-cell populations, are shown. (Ai) Left shows dual negative Th1 ICS profile: Control: N = 8 rats, 0.280 ± 0.154 %; RSDS: N = 9 rats, 0.220 ± 0.096 %; t = 0.337, df = 15, p = 0.74, unpaired t-test. Right shows dual negative: Control: N = 9 rats, 40.20 ± 7.785 %; RSDS: N = 9 rats, 44.90 ± 7.845 %; t = 0.425, df = 16, p = 0.67, unpaired t-test. (Aii) Left shows dual positive: Control: N = 9 rats, 8.664 ± 5.071 %; RSDS: N = 9 rats, 18.52 ± 10.27 %; U = 29, p = 0.33, Mann-Whitney U test. Right shows dual positive: Control: N = 8 rats, 87.77 ± 2.910 %; RSDS: N = 8 rats, 89.05 ± 2.549 %; U = 29, p = 0.79, Mann-Whitney U test. (Aiii) Left shows CD4+ T-cells: Control: N = 8 rats, 1.630 ± 1.158 %; RSDS: N = 9 rats, 1.962±1.098 %; U = 26, p = 0.34, Mann-Whitney U test. Right shows CD4+ T-cells: Control: N = 7 rats, 30.55 ± 6.841 %; RSDS: N = 8 rats, 54.45 ± 6.190 %; t = 2.596, df = 13, p = 0.022, unpaired t-test. (Aiv) Left shows CD8+ T-cells: Control: N = 9 rats, 0.508 ± 0.374 %; RSDS: N = 9 rats, 0.751 ± 0.494 %; U = 35, p = 0.63, Mann-Whitney U test. Right shows CD8+ T-cells: Control: N = 7 rats, 37.34 ± 5.984 %; RSDS: N = 8 rats, 63.55 ± 7.452 %; t = 2.688, df = 13, p = 0.018, unpaired t-test.
Together, the data show that only the CD4+ and CD8+ T-cells positive for Th2 (or Tc2, respectively) cytokines are significantly increased. * indicates p < 0.05; unpaired t-test. Gating was done for each antibody based on the non-specific binding of the appropriate negative isotype stained controls. (B) Representative scatter plots from flow cytometric analysis of (A) DN T-cells (B) DP T-cells (C) CD4+ T-cells and (D) CD8+ T-cells are shown. Gating was done for each antibody based on the non-specific binding of the appropriate negative isotype stained controls. (Ci) PCA analysis (left) and correlation matrix (right) support the grouping of T-cells into discrete groups. This was further confirmed with hierarchical clustering analysis, with 3 groups emerging (bottom). (Cii) RSDS had no significant effect on any individual group (left). However, RSDS significantly shifted the balance towards Group 3 (IFNg T-cell), and away from Group 1 (mostly IL4 T-cells; middle). The balance between traditionally defined groups (IL4 or IFNg), with no significant effect of RSDS emerging (right). A significant correlation between number of attacks and Group 1, as well as the balance between Group 1:Group 3, was observed (bottom; p < 0.05 after corrections). Number of attacks indicates the total number of attacks received during the days of defeat. * indicates p < 0.05 vs. control. Data shown as mean ± S.E.M.

