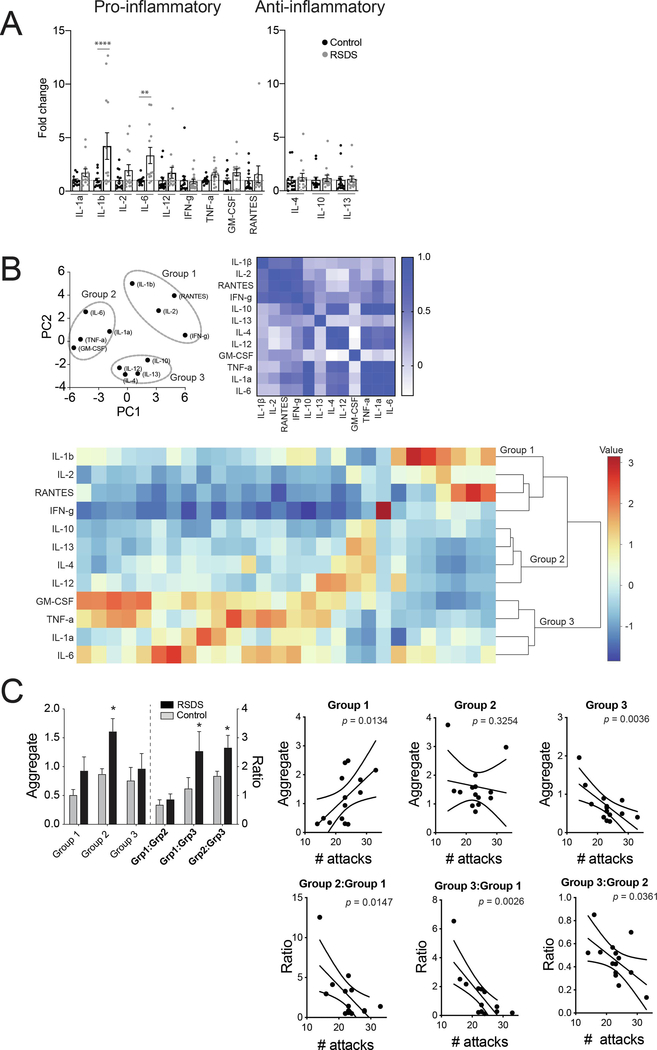
Figure 5: RSDS increases pro-inflammatory, but not anti-inflammatory, cytokine levels in serum.
We tested whether RSDS alters serum pro-inflammatory cytokine profiles in peripheral blood. On the third day after the last session of RSDS or control handling, blood samples were collected and processed to obtain serum samples (Methods). (A) Pro-inflammatory cytokine profiles. Fold-changes of different pro-inflammatory cytokines are shown. IL-1β and IL-6 show a significant increase after RSDS compared to control (Bonferroni’s multiple comparisons test). IL-1α (Control: N = 12 rats, 1.00 ± 0.137; RSDS: N = 13 rats, 1.715 ± 1.317; t = 1.123, p > 0.05). IL-1β (Control: N = 12 rats, 1.00 ± 0.209; RSDS: N = 13 rats, 4.210 ± 1.242; t = 5.043, ****p < 0.001), IL-2 (Control: N = 14 rats, 1.00 ± 0.222; RSDS: N = 14 rats, 1.953 ± 0.520; t = 1.586, p > 0.05). IL-6 (Control: N = 12 rats, 1.00 ± 0.106; RSDS: N = 13 rats, 3.328 ± 0.758; t = 3.658, **p < 0.01), IL-12 (Control: N = 14 rats, 0.9999 ± 0.293; RSDS: N = 14 rats, 1.710 ± 0.509; t = 1.182, p > 0.05), IFN-γ (Control: N = 14 rats, 1.000 ± 0.396; RSDS: N = 14 rats, 0.908 ± 0.209; t = 0.1520, p > 0.05). TNF-α (Control: N = 13 rats, 1.00 ± 0.087; RSDS: N = 14 rats, 1.548 ± 0.224; t = 0.8943, p > 0.05). GM-CSF (Control: N = 14 rats, 1.00 ± 0.217; RSDS: N = 14 rats, 1.755 ± 0.337; t = 1.257, p > 0.05). RANTES (Control: N = 14 rats, 1.000 ± 0.277; RSDS: N = 11 rats, 0.802 ± 0.111; t = 0.9181, p > 0.05). (B) Anti-inflammatory cytokine profiles. There is no fold-change in the anti-inflammatory cytokine levels after RSDS. IL-4 (Control: N = 14 rats, 1.000 ± 0.308; RSDS: N = 14 rats, 1.263 ± 0.366; t = 0.436, p > 0.05, IL-10 (Control: N = 13 rats, 1.000 ± 0.268; RSDS: N = 14 rats, 1.171 ± 0.293; t = 0.278, p > 0.05 and IL-13 (Control: N = 14 rats, 1.000 ± 0.335; RSDS: N = 14 rats, 1.095 ± 0.280; t = 0.157, p > 0.05.) In this panel, ****indicates p < 0.0001, **indicates p < 0.01 vs. respective controls; Bonferroni’s multiple comparisons test. (B) PCA analysis was used to group cell types (left). This was followed by correlation matrix to visually confirm that changes in grouped cell types were correlated (right; color bar indicates Pearson r value). The grouping was computationally confirmed with hierarchical clustering analysis (bottom). Three groups emerged, Group 1 (IL-1b, IL-2, IFNg, RANTES); Group 2 (IL-1a, IL-6, TNFa, GM-CSF); Group 3 (IL-4, IL-10, IL-12, IL-13).
(C) RSDS significantly increased Group 2 (left), and shifted the balance away from Group 3, towards Group 1 and Group 2. The correlations between the number of attacks and key measures is shown here (right), with significant correlations between attacks and Group 1, and Group 3 (p < 0.05 after correlations), and between attacks and the balances between all groups (p < 0.05 after correlations). Number of attacks indicates the total number of attacks received during the days of defeat. * indicates p < 0.05 vs. control. Data shown as mean ± S.E.M.

