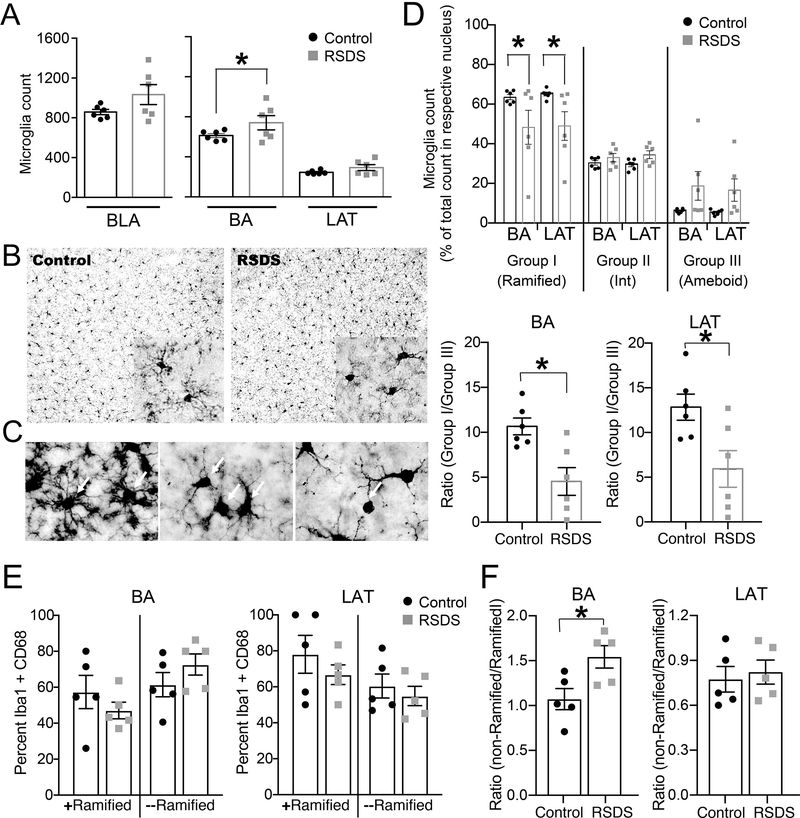
Figure 6: RSDS increases microglia count in the BA nuclei of BLA and causes microglial activation in BLA.
Rats were exposed to RSDS or control handling. Microglia were identified by staining with Iba-1 antibody by immunohistochemistry of rat brain sections containing BLA (Methods). (A) Left panel: Microglia count shows a trend towards increase in the BLA (Control: 857.8 ± 26.28 / 6 rats, RSDS: 1033 ± 100.4 / 6 rats; t = 1.689, df = 10, p = 0.122, unpaired t-test). Right panel: Microglia count is increased in the BA nucleus (p = 0.035; Control: 612.8 ± 19.90 / 6 rats, RSDS: 740.4 ± 71.08 / 6 rats) but is unchanged in the LAT nuclei (p = 0.408; Control: 245.0 ± 7.823 / 6 rats, RSDS: 292.6 ± 29.37 / 6 rats). (B) Representative images from control and RSDS groups showing the microglia under 20X magnification. Inset shows image in 100X objective lens magnification. (C) Different morphologies of microglia are shown by respective white arrows. Left: Group I (ramified) microglia. Middle: Group II (intermediate) microglia. Right: Group III (ameboid) microglia. (D) Upper panel: Stress shifted the proportion of microglia types (stress × microglia group interaction, p = 0.042, F(6,40) = 2.433, two-way RM-ANOVA), with a decrease in Group I microglia in the BA and in the LAT (p<0.05, post hoc Bonferroni multiple comparisons test). Lower panel: The ratio of Group I/Group III microglia was shifted after stress compared to controls for both BA (t = 3.39, DF = 10, p = 0.007) and LAT (t = 2.741, DF = 10, p = 0.021). (E) Stress did not consistently impact the percent of cells double-labeled for Iba-1 and CD68 in the BA (left; stress × microglia interaction, p = 0.67, F(1,8) = 0.197; main effect of stress, p = 0.33, F(1,8) = 1.10, two-way ANOVA, n = 5 rats/group), or LAT (right; stress × microglia interaction, p = 0.28, F(1,8) = 1.33; main effect of stress, p = 0.84, F(1,8) = 0.04, two-way ANOVA, n = 5 rats/group). (F) Stress shifted the percent of cells that were double-labeled and minimally ramified relative to double-labeled ramified cells in the BA (p = 0.025, t = 2.744, df = 8, two-tailed unpaired t-test), with no consistent effect in the LAT (p = 0.69, t = 0.41, df = 8, two-tailed unpaired t-test). Values indicate mean ± S.E.M. * indicates p < 0.05.

