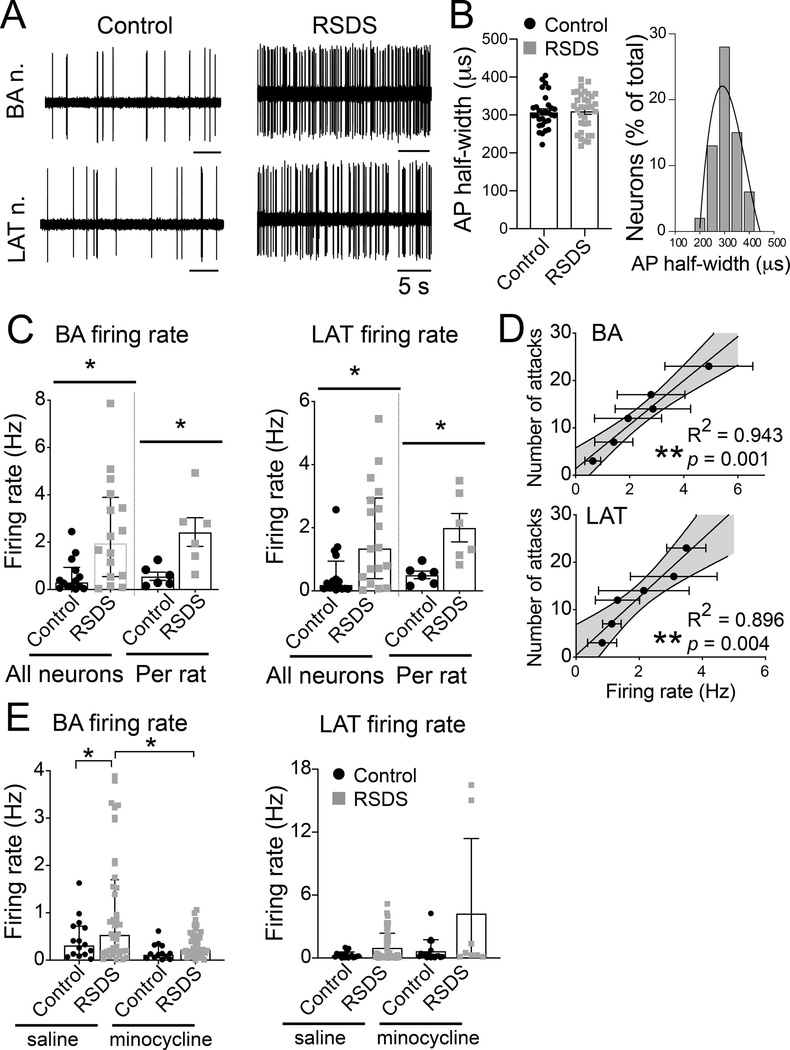
Figure 7: RSDS increases neuronal firing in BA and LAT nuclei of BLA similarly.
Rats were exposed to RSDS or control handling, and the neuronal firing was recorded using in vivo single-unit extracellular electrophysiology (Methods). (A) Representative traces of electrophysiological recordings from BA (upper panel) and LAT (lower panel) nuclei. (B) AP half-width was similar in the control and RSDS groups. Right: Frequency distribution of the AP half-width from all the recorded BLA neurons show a single population, likely pyramidal neurons. N = 6 rats / group; likely projection neurons, based on action potential half-width; Control 307.8 ± 8.0 μs, n = 30 neurons, RSDS 310.6 ± 8.5 μs, n = 34 neurons; p (RSDS vs. Control) = 0.813; unpaired t-test; BA 320.4 ± 8.0 μs, n = 30 neurons; LAT 299.6 ± 8.2 μs, n = 34 neurons. BA: Control 0.59 ± 0.19 Hz, n = 14 neurons; RSDS 2.44 ± 0.55 Hz, n = 16 neurons; U = 46.50, p = 0.0054, Mann-Whitney U test. LAT: Control 0.52 ± 0.18 Hz, n = 16 neurons; RSDS 1.78 ± 0.38 Hz, n = 18 neurons; U = 69.50, p = 0.0090, Mann-Whitney U test. (C) Firing rate was significantly increased after RSDS in BA (left) and LAT (right). Data of individual firing rate from all neurons (median ± interquartile range) and those averaged per rat is shown. (D) Significant correlation between the number of attacks and firing rate was seen in both the BA (top) and LAT (bottom) nuclei of RSDS rats. Number of attacks indicates the total number of attacks received during all 5 days of defeat. (E) Blockade of microglia activation by minocycline diminished the firing rate of neurons in the repeated stress condition for BA (left) but not LAT (right). Control-saline N = 7 rats; control-minocycline N = 5 rats; stress-saline N = 11 rats; stress-minocycline N = 7 rats. Minocycline reduced the effects of repeated stress on BA neuron firing (main effect p = 0.039, F(1,127) = 4.35, two-way ANOVA; control-saline n = 15 neurons, control-minocycline n = 16 neurons, stress-saline n = 49 neurons, stress-minocycline n = 51 neurons), but did not exert consistent effects on LAT neuron firing (main effect p = 0.162, F(1,81) = 1.99; control-stress n = 14 neurons, control-minocycline n = 18 neurons, stress-saline n = 48 neurons, stress-minocycline n = 8 neurons). Values plotted are mean ± SEM unless otherwise noted above. Shaded area indicates 95% confidence intervals. * indicates p < 0.05; ** indicates p < 0.01.

