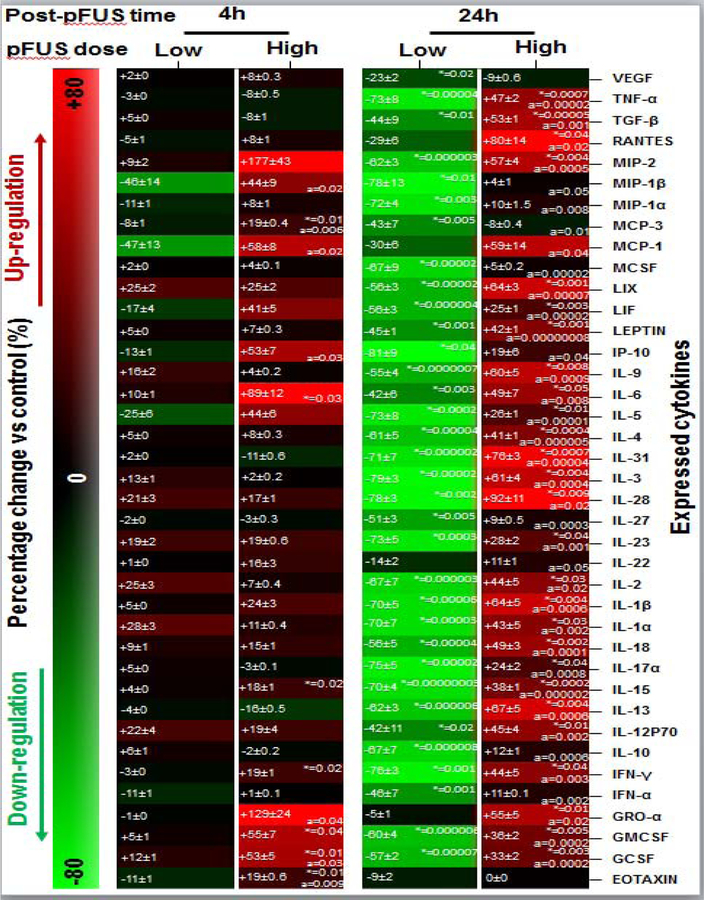
Figure 3. Molecular analysis of pFUS treated pancreases:
Molecular expression profile of the pancreas following pFUS treatment relative to control mice. In each box, the left side values are mean±SEM and right side are P-values.
Significant differences: *P<0.05: pFUS treated pancreas vs. control, aP<0.05: high dose vs. low dose (Two-way ANOVA post-hoc Tukey Test).

