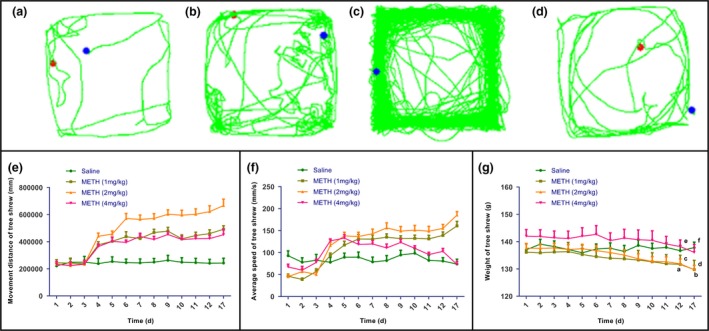
Figure 2.

Effects of different doses of METH on motion trajectory, movement distance, average speed, and body weight of the tree shrews. The enclosed photograph illustrates the change of motion trajectory diagram for the tree shrews during the expression period of behavioral sensitization (d17) for control group (a), METH at 1 mg/kg (b), 2 mg/kg (c), and 4 mg/kg (d). (e) Effects of different doses of METH on movement distance of the tree shrews. (f) Effects of different doses of METH on average speed of the tree shrews. (g) Effects of different doses of METH on weight of the tree shrew (a = p 1 mg/kg < .001 on d12; b = p 1 mg/kg < .001 on d17; c = p 2 mg/kg < .001 on d12; d = p 2 mg/kg < .001 on d17; e = p 4 mg/kg < .01 on d12; f = p 4 mg/kg < .01 on d17). Data were presented as mean ± SEM. N = 10 per group
