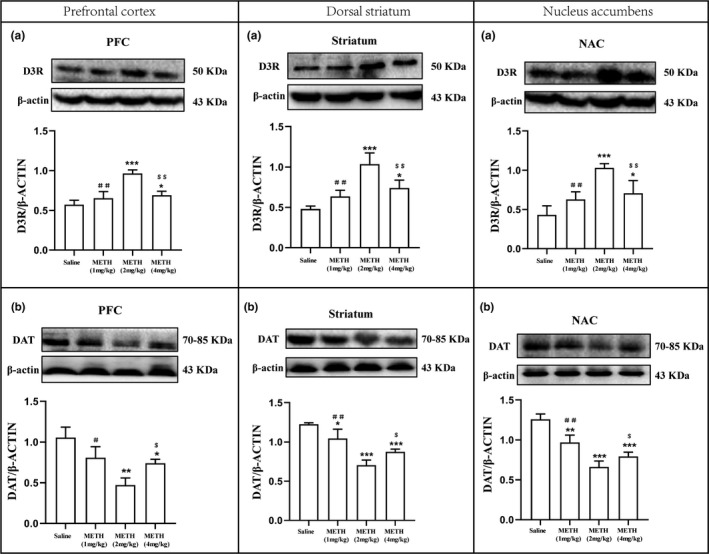
Figure 3.

Regulation of different doses of METH to the expressions of D3R and DAT in the prefrontal cortex (PFC) (left panel a and b), dorsal striatum (DS) (middle panel a and b), and nucleus accumbens (NAc) (right panel a and b) per the METH‐induced behavioral sensitization model of the tree shrews. β‐actin‐normalized protein levels of D3R and DAT were determined using Western blot. Representative blot images are shown. *p < .05, **p < .01, ***p < .001 compared to the saline‐paired control group. # p < .05, ## p < .01 compared to the 2 mg/kg METH group. $ p < .05, $$ p < .01 compared to the 2 mg/kg METH group. Data were presented as mean ± SEM. N = 3 per group of the behaviorally sensitized tree shrews
