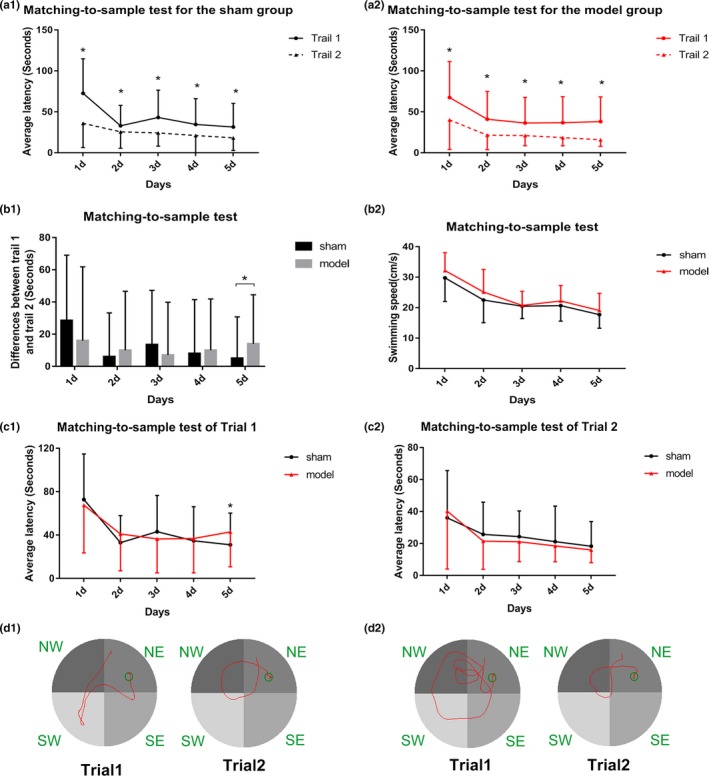
Figure 5.

Results of the sham and model groups in the matching‐to‐sample test of the Morris water maze for the average latency of Trial1 and Trial2 (a1) in the sham group and (a2) the model group. (b1) Differences between Trial1 and Trial2 of the sham and model groups for (b2) the swimming speed. (c1 and c2) Average latency of Trial1 and Trial2 between the sham and model groups, respectively. (d1) Swimming trajectory images of the sham group in Trial1 and Trial2. (d2) Swimming trajectory images of the model group in Trial1 and Trial2. *p < .05
