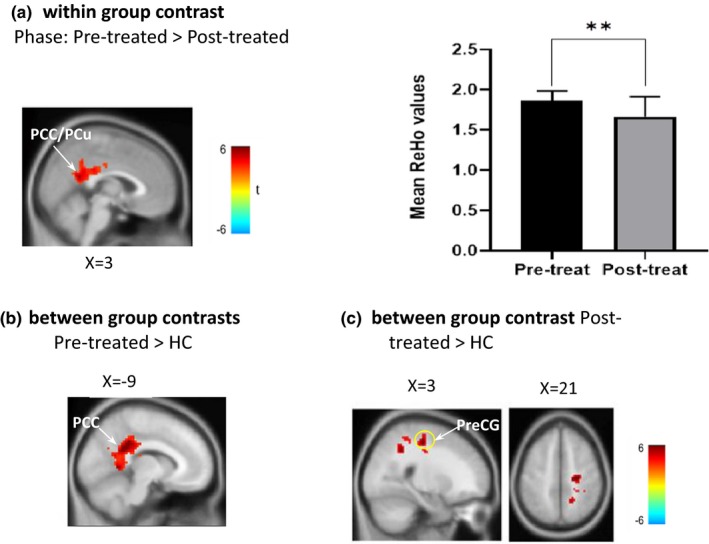
Figure 2.

Statistic maps in ReHo analysis of between‐group and between‐phase comparisons. (a) Comparison of patient groups between the pretreated and post‐treated phases. Comparison of the post‐treated sciatica group with the healthy group, showing ReHo in PCC (b) and right precentral gyrus (marked with yellow circle) (c). HC, healthy control; PCC, posterior cingulate cortex; Post‐treated, patients with sciatica after acupuncture treatment; PreCG, precentral gyrus; Pretreated, patients with sciatica before acupuncture treatment; ReHo, regional homogeneity. *Significant differences in between‐phase comparisons, **p < .01
