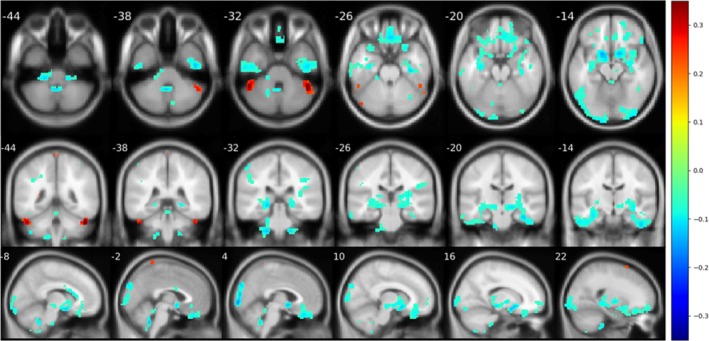
Figure 8.

Significant difference (p < .05) reported from seed‐based analysis with seed in posterior lobe. Images are shown in a threshold of an absolute value 0.1 for the mean difference between two groups. Frontal cortex and occipital cortex were reported with an abnormal decline in seed‐based analysis. Furthermore, there was also a correlation decline in basal ganglia
