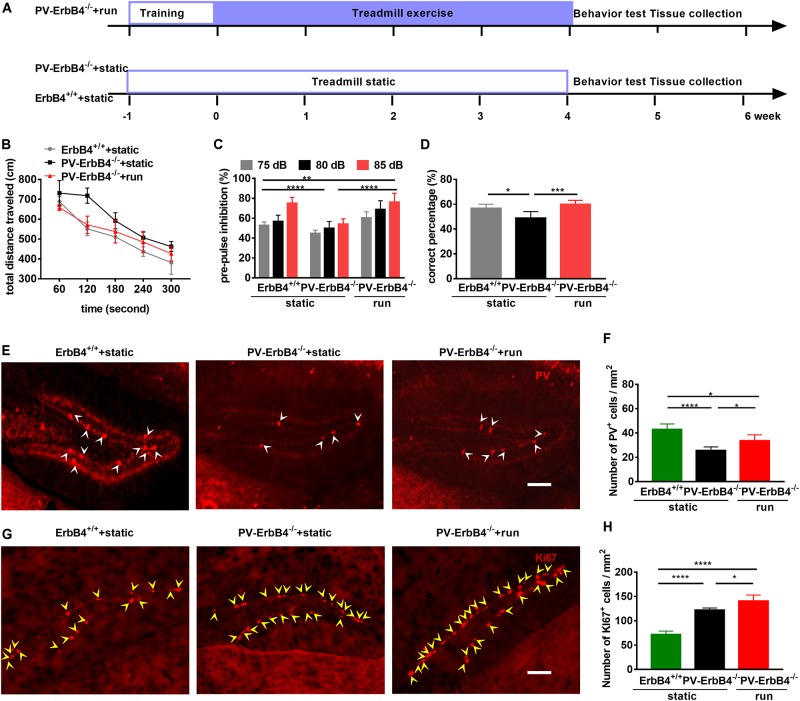
FIGURE 6.
Treadmill running improves schizophrenia-related behavioral phenotypes and increases adult neurogenesis in the dentate gyrus (DG) of PV-ErbB4–/– mice. (A) Schematic experimental design for PV-ErbB4–/– mouse. (B) Hyper-locomotion of PV-ErbB4–/– mice is inhibited by running. Data are expressed as mean ± SEM, and there were six mice in ErbB4+/+ + static group, nine mice in PV-ErbB4–/– + static group and six mice in PV-ErbB4–/– + run group. Two-way ANOVA, F2,90 = 42.79, P < 0.0001; post hoc test: ErbB4+/+ + static group vs. PV-ErbB4–/– + static: P < 0.0001, PV-ErbB4–/– + static group vs. PV-ErbB4–/– + run: P < 0.0001. (C) Prepulse inhibition deficits in PV-ErbB4–/– mice are attenuated by treadmill running. Data are expressed as mean ± SEM, and there were six mice in ErbB4+/+ + static group, nine mice in PV-ErbB4–/– + static group and six mice in PV-ErbB4–/– + run group. Two-way ANOVA, F2,90 = 42.79, P < 0.0001; post hoc test: **P < 0.01, ****P < 0.0001. (D) Working memory deficits in PV-ErbB4–/– mice are attenuated by running. Data are expressed as mean ± SEM, and there were six mice in ErbB4+/+ + static group, nine mice in PV-ErbB4–/– + static group and six mice in PV-ErbB4–/– + run group. Two-way ANOVA, F2,51 = 47.38, P < 0.0001; post hoc test: *P < 0.05, ***P < 0.001. (E) Representative photomicrographs showing PV-positive interneurons in the DG. Arrowheads (in white) indicate PV-positive cells in the DG. Scale bar, 100 μm. (F) Quantitative analysis of PV-positive cells in the DG. Data are expressed as mean ± SEM, and there were five mice in each group. One-way ANOVA, F2,12 = 21.78, P = 0.0001; post hoc test: ***P < 0.001, ****P < 0.0001. (G) Representative photomicrographs showing Ki67-positive cells in the DG. Arrowheads (in yellow) indicate Ki67-positive cells in the DG. Scale bar, 100 μm. (H) Quantitative analysis of Ki67-positive cells in the DG. Data are expressed as mean ± SEM, and there were five mice in each group. One-way ANOVA, F2,12 = 89.86, P < 0.0001; post hoc test: *P < 0.05, ****P < 0.0001.

