Figure 5.

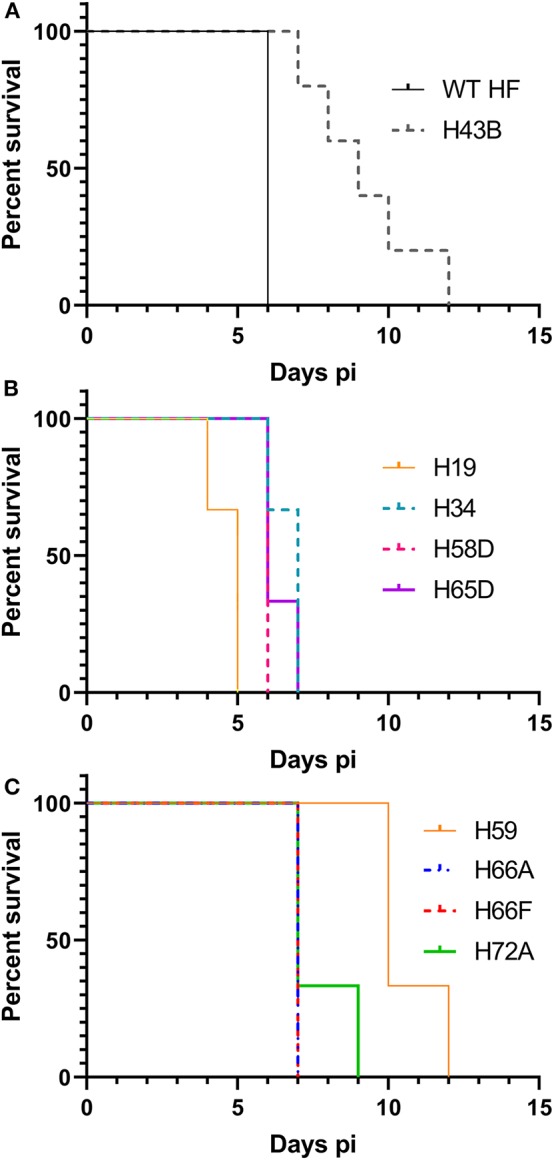
Kaplan-Meier survival curves for mice inoculated with nine cloned mutants. (A) Wild type and H43B. Compared with WT, H43B survived significantly longer, P < 0.05 by the Log-rank test (N = 5). (B,C) Compared to H59, each clone P < 0.05 by the Log-rank test (N = 3). (B,C) Were separated for figure clarity.
