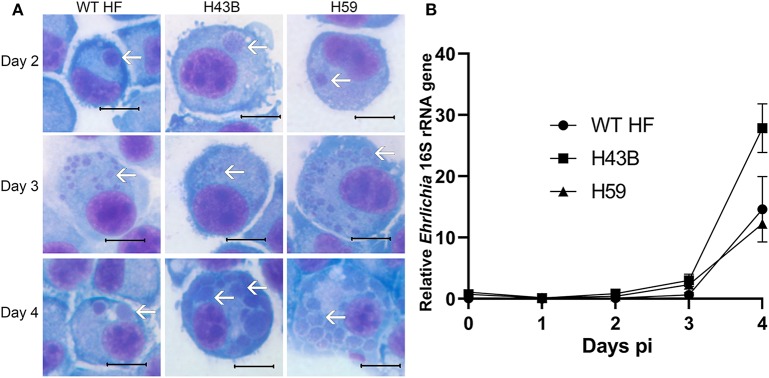
Figure 6.
Growth curves of H43B and H59 clones. (A) DH82 cells were infected with WT HF, H43B, and H59 clones. Representative HEME3 staining images were shown at day 2, 3, or 4 post-infection. White arrows, ehrlichial microcolonies (morulae). Scale bar, 10 μm. (B) Growth curve showing WT HF, H43B, and H59 in DH82 cells as determined by qPCR. Infection and growth of H59 and H43B mutants in DH82 cells were similar by repeated-measures ANOVA, P > 0.05 (N = 3).

