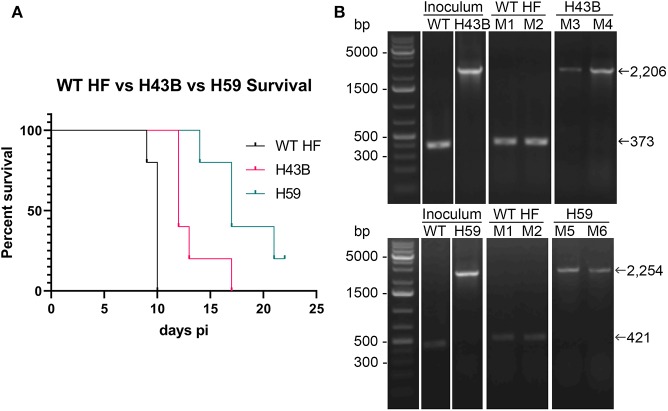
Figure 7.
Kaplan-Meier survival curves and flank PCR to detect the clonality of H34B and H59. (A) Kaplan-Meier survival curves for two Himar1 mutant clones, P < 0.001 by Log-rank, Gehan-Breslow-Wilcoxon test (N = 5). (B) Flank PCR showing that WT-, H43B-, and H59-infected DH82 cells (inoculum), and liver tissues of Mouse 1 (M1) and Mouse 2 (M2) inoculated with WT and died at day 10 (WT HF), Mouse 3 (M3) and Mouse 4 (M4) died at day 12 and 17, respectively (H43B, top panels), and Mouse 5 (M5) and Mouse 6 (M6) died at day 14 and 21, respectively (H59, bottom panels). For H43B, EHF_RS04100 primers (Table S1) flanking H43B insertion site were used, showing 373 and 2,206 bp without and with Himar1 insert, respectively. For H59, EHF_0962 primers (Table S1) flanking H59 insertion site were used, showing 421 and 2,254 bp without and with Himar1 insert, respectively.

