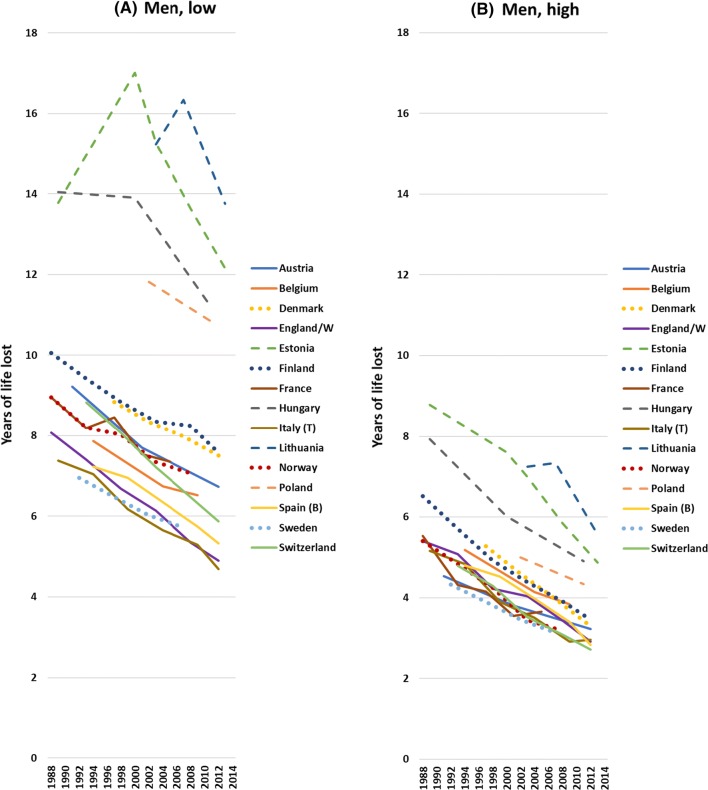
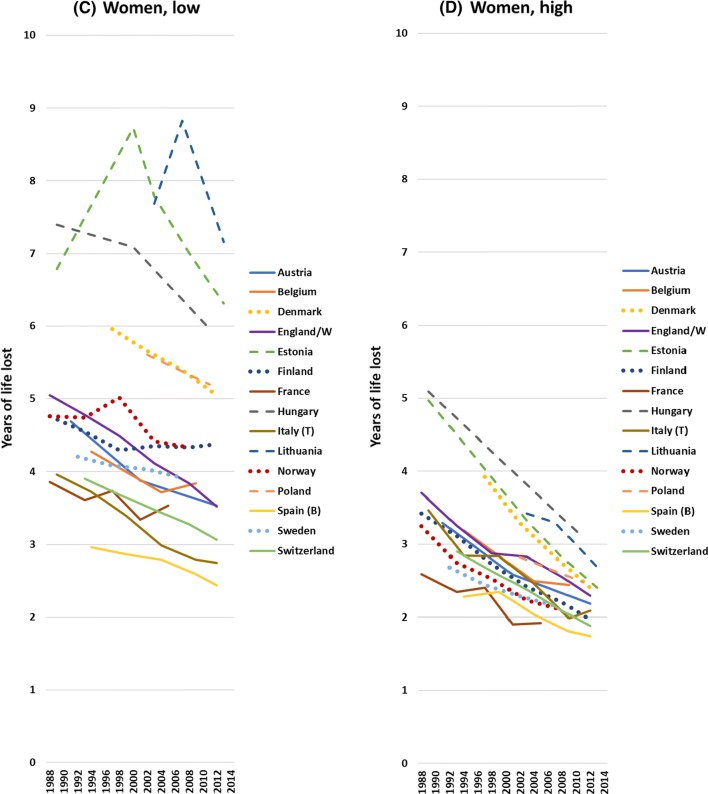
Fig. 1.
Trends in years of life lost between the ages of 35 and 80 years, by country, gender and level of education. Notes Years of life lost calculated as partial life expectancy (between the ages of 35 and 80 years) minus 45 years. Dashed lines: Eastern European countries; dotted lines: Northern European countries. Scale for men and women different


