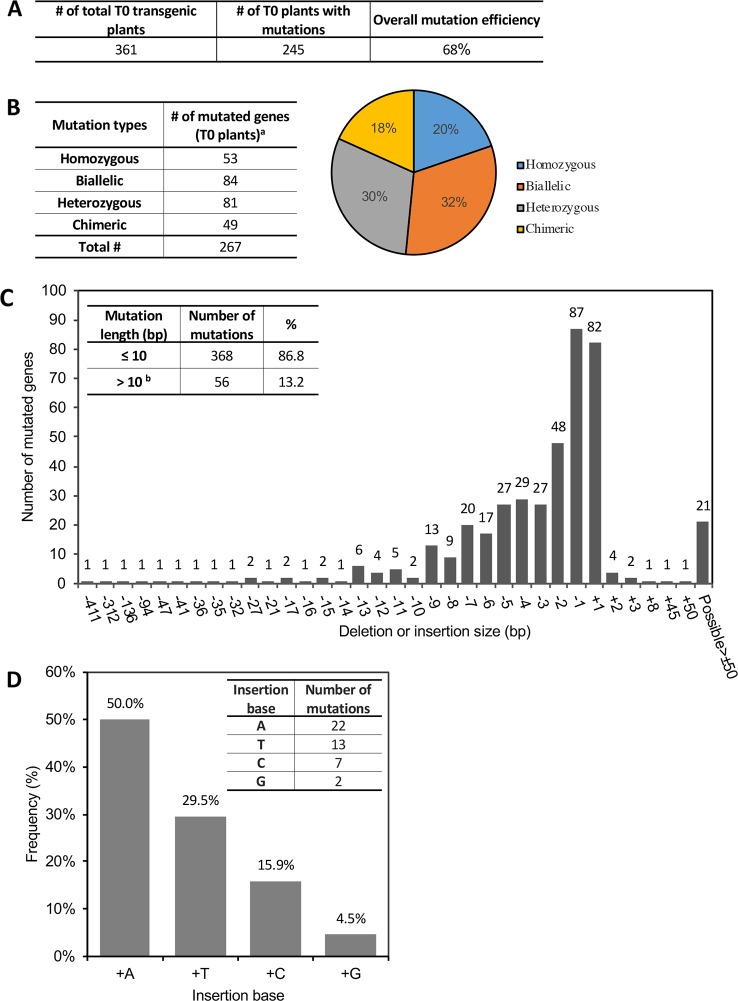
Figure 2.
CRISPR/Cas9-induced gene mutations in T0 transgenic plants. See also Table S3 . (A) The average mutation rate induced by CRISPR/Cas9 in T0 plants. (B) Summary of CRISPR-induced mutation types and their frequency in T0 plants. Left: Number of genes modified with the corresponding mutation type; Right: Percentage of genes harboring the corresponding mutation type. a Some plants have multiple target genes in one plant. (C) Frequency of each insertion or deletion mutation. x-axis: number of base pairs (bp) deleted (−) or inserted (+) into target sites. Inset on the left top shows the percentage of mutations ≤10 bp or >10 bp. bAll “possible > ± 50 bp” in the figure are included in >10 bp. TIDE only calculates mutation length ≤50 bp. (D) Percentage of different bases in the 1-bp insertion mutations. Inset at the right top shows the number of mutations with each type of inserted base.

