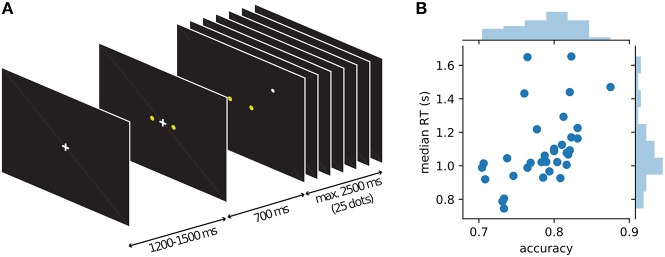
Figure 2.
Course of events within a trial in the single dot task and behavior of individual participants. (A) Each trial started with the presentation of a fixation cross, followed by the appearance of the two yellow targets after about 1 s. 700 ms after the appearance of the targets the fixation cross disappeared and a single white dot was presented at a random position on the screen (drawn from a 2D-Gaussian distribution centered on one of the targets). Every 100 ms the position of the white dot was changed to a new random draw from the same distribution. Participants were instructed to indicate the target which they thought was the center of the observed dot positions. After 25 dot positions (2.5 s) without a response, a new trial was started automatically, otherwise a new trial started with the response of the participant. (B) Average behavior (accuracy and median response time) for each of the 34 participants shown as blue dots and histograms.

