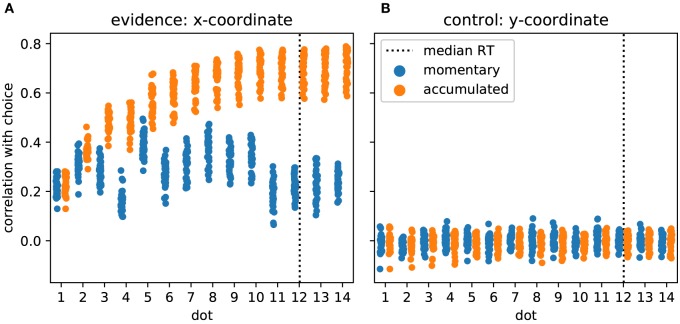
Figure 3.
Participants accumulate momentary evidence provided by dot positions for making their decisions. (A) Each shown point corresponds to the Pearson correlation coefficient for the correlation between choices of a single participant and the sequence of presented dot positions across the 480 trials of the experiment. We plot, over stimulus duration, the momentary (blue) and the accumulated evidence (orange). The dotted vertical line shows the median RT across participants. Until about the 10th dot presentation the correlation between accumulated evidence and participant choices rises, reaching values around 0.7 while the momentary evidence is only modestly related to participant choices across all dots. (B) The same format as in A but all measures are computed from the y-coordinates of dot positions which were irrelevant for the decision. As expected, y-coordinates do not correlate with participant choices.

