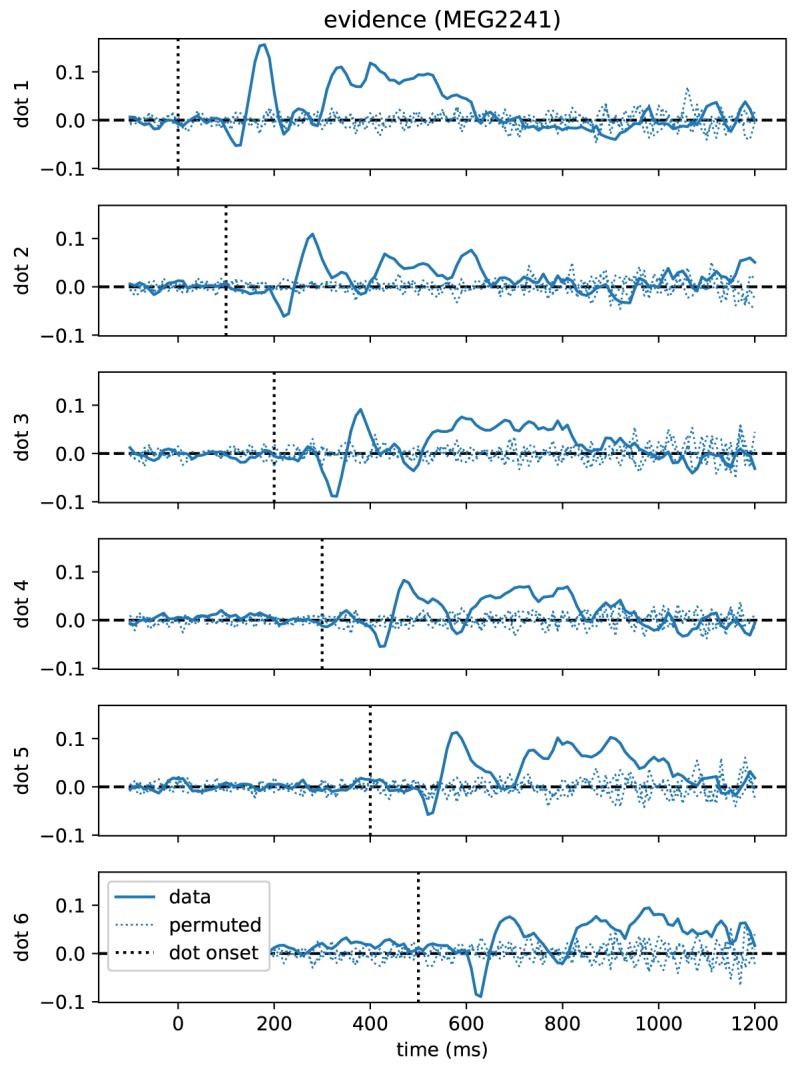
Figure 4.

Time course of correlations with momentary evidence repeats for each dot shifted by dot onset times. In the standard regression analysis there was one regressor for each element in the sequence of dot positions (dots). This allowed us to test, when after first dot onset, correlations with the considered dot could be observed. The figure demonstrates, for the magnetometer channel with the strongest average correlations, that the correlation time course exhibits roughly a stereotyped profile relative to the onset time of the dot on the second level (average across subjects, grand average). Dotted lines show the same quantity, but for data that we permuted over trials before the regression analysis.
