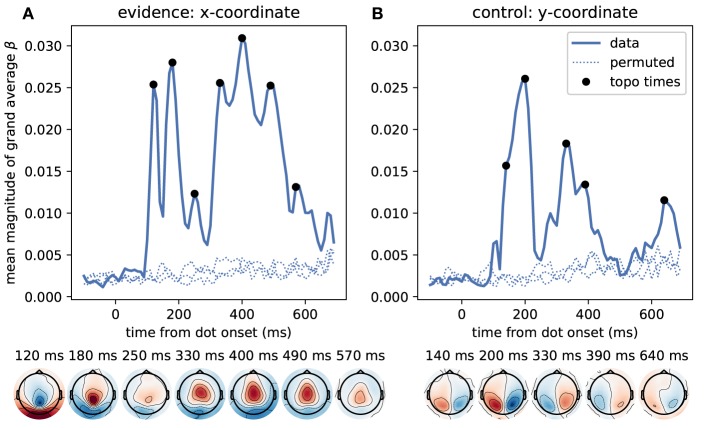
Figure 5.
Time course of correlation strengths between magnetometer measurements and momentary evidence and perceptual control variable. (A) The top panel shows the time courses of the mean (across sensors) magnitude of grand average regression coefficients (β). For comparison, dotted lines show the corresponding values for data which were randomly permuted across trials before statistical analysis. Black dots indicate time points for which the sensor topography is shown below the plot. These topographies directly display the grand average regression coefficients at the indicated time without rectification, i.e., with negative (blue) and positive (red) correlation values. The momentary evidence has strong correlations with the magnetometer signal at 120, 180 ms and from about 300 to 500 ms after dot onsets. (B) The correlations with the decision irrelevant y-coordinate are visibly and significantly weaker than for the evidence, but there are two prominent peaks from about 120 to 210 ms and at 320 ms after dot onset. There is no sustained correlation with the y-coordinate beyond 400 ms and the topographies of magnetometers differ strongly between evidence and y-coordinates. Specifically, the evidence exhibits occipital, centro-parietal and central topographies whereas the y-coordinate exhibits strong correlations only in lateral occipito-parietal sensors.

